Fig. A.3
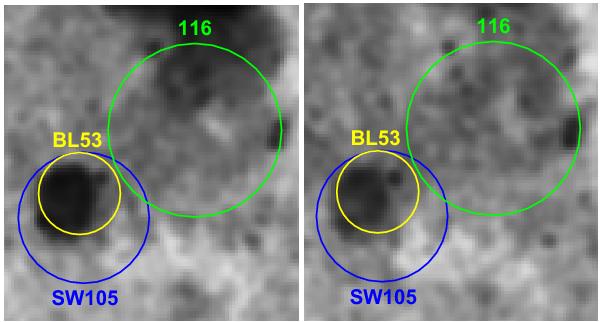
Emission line HST/WFC3 images of the region surrounding source No. 116. Left panel: WFC3 image with the narrowband filter F657N, corresponding to Hα line emission. Right panel: WFC3 image with the narrowband filter F673N, corresponding to SII line emission. The radii of the circles of Chandra (SW105) and XMM-Newton (116) sources give the 3σ accuracy of the position of the sources. The circle labelled BL53 gives the position of the opitcal SNR candidate.
Current usage metrics show cumulative count of Article Views (full-text article views including HTML views, PDF and ePub downloads, according to the available data) and Abstracts Views on Vision4Press platform.
Data correspond to usage on the plateform after 2015. The current usage metrics is available 48-96 hours after online publication and is updated daily on week days.
Initial download of the metrics may take a while.