Fig. 7
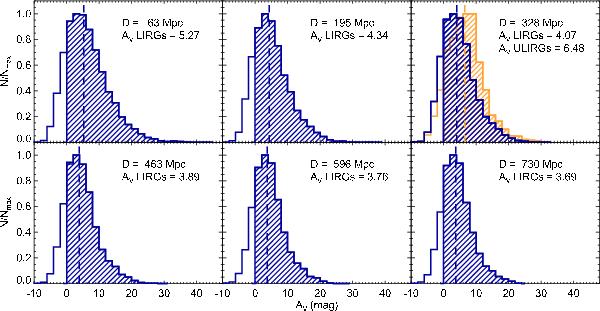
Different simulations of the LIRGs AV distribution for increasing distance (from top to bottom and left to right). The median of each distribution is highlighted with a vertical dashed line. The distance and the median AV of the simulated distribution is annotated in each panel. The top left panel corresponds to the average distance of the ULIRG subsample, and shows the observed AV distribution of the ULIRGs and its median, in yellow.
Current usage metrics show cumulative count of Article Views (full-text article views including HTML views, PDF and ePub downloads, according to the available data) and Abstracts Views on Vision4Press platform.
Data correspond to usage on the plateform after 2015. The current usage metrics is available 48-96 hours after online publication and is updated daily on week days.
Initial download of the metrics may take a while.