Fig. 5
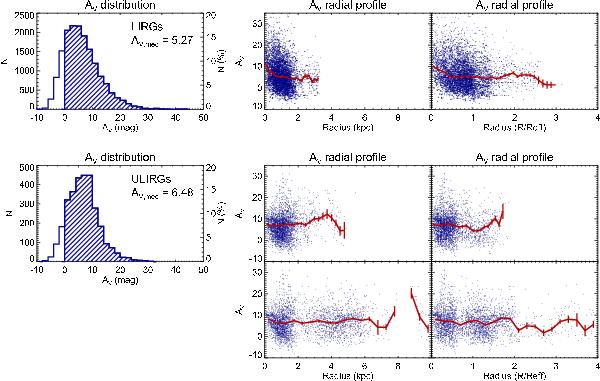
AV distributions and radial profiles of the LIRGs (top) and ULIRGs (bottom) subsamples on a spaxel-by-spaxel basis. The median AV values of each distribution are shown in the left panels. In the central and right panels, the radial profiles are plotted in terms of the radius in kpc (centre) and in units of the Hα effective radius (Reff, right panel) extracted from Arribas et al. (2012). The red line represents the weighted mean of AV and its error for different radial bins in steps of 1/30 of the total radial coverage. For the ULIRG subsample, we plotted the radial profile of the sample by considering each component of the systems separately (top) and the profile extracted by taking the brightest nucleus in the K-band continuum as the centre of the systems (bottom).
Current usage metrics show cumulative count of Article Views (full-text article views including HTML views, PDF and ePub downloads, according to the available data) and Abstracts Views on Vision4Press platform.
Data correspond to usage on the plateform after 2015. The current usage metrics is available 48-96 hours after online publication and is updated daily on week days.
Initial download of the metrics may take a while.