Fig. 4
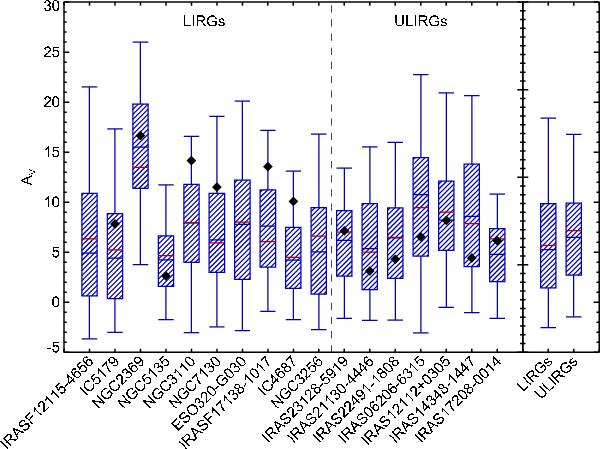
Individual AV distributions, on a spaxel-by-spaxel basis, of the galaxies of the sample ordered by increasing LIR. The extremes of the distributions are the 5th and 95th percentiles (P5 and P95). The boxes illustrate the interquartile range, whereas the horizontal blue and red lines correspond to the median and the weighted mean of the distribution, respectively. The measurements of the nuclear extinction are plotted as black diamonds. The total AV distributions for LIRGs and ULIRGs are shown on the right-hand side of the plot.
Current usage metrics show cumulative count of Article Views (full-text article views including HTML views, PDF and ePub downloads, according to the available data) and Abstracts Views on Vision4Press platform.
Data correspond to usage on the plateform after 2015. The current usage metrics is available 48-96 hours after online publication and is updated daily on week days.
Initial download of the metrics may take a while.