Fig. 3
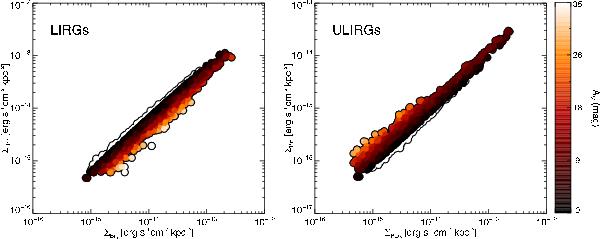
Surface brightness distributions of the individual spaxels of LIRGs and ULIRGs. For clarity, we only plot a random distribution of the 20% and 50% of the points for LIRGs and ULIRGs, respectively. The colour code indicates the AV value of each spaxel, whereas the points with AV < 0 are outlined with a black contour line. The increase in the extinction towards low surface brightness values is mainly due to the high uncertainties of the flux measurements, in particular in ULIRGs, where the highest AV values correspond to the spaxels with the lower Brγ surface brightness.
Current usage metrics show cumulative count of Article Views (full-text article views including HTML views, PDF and ePub downloads, according to the available data) and Abstracts Views on Vision4Press platform.
Data correspond to usage on the plateform after 2015. The current usage metrics is available 48-96 hours after online publication and is updated daily on week days.
Initial download of the metrics may take a while.