Fig. 5
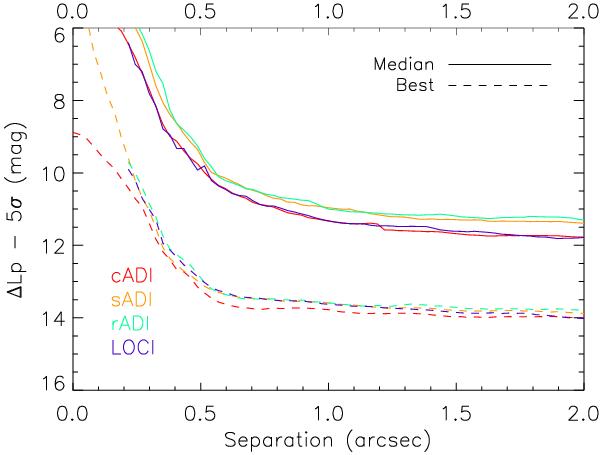
Survey detection limits in L′-band contrast between the central star and any point source vs. the angular separation at the 5σ level using the VLT/NaCo in ADI mode. Solid lines are representative of median performances, whereas the bottom dashed lines are for the best performance reached by our survey. cADI (red) and LOCI (blue) are very similar, whereas sADI (orange) and rADI (aqua) remain slightly above the LOCI and cADI curves. The LOCI curves stop at 0.15 ″ because of the central exclusion area.
Current usage metrics show cumulative count of Article Views (full-text article views including HTML views, PDF and ePub downloads, according to the available data) and Abstracts Views on Vision4Press platform.
Data correspond to usage on the plateform after 2015. The current usage metrics is available 48-96 hours after online publication and is updated daily on week days.
Initial download of the metrics may take a while.