Fig. 11
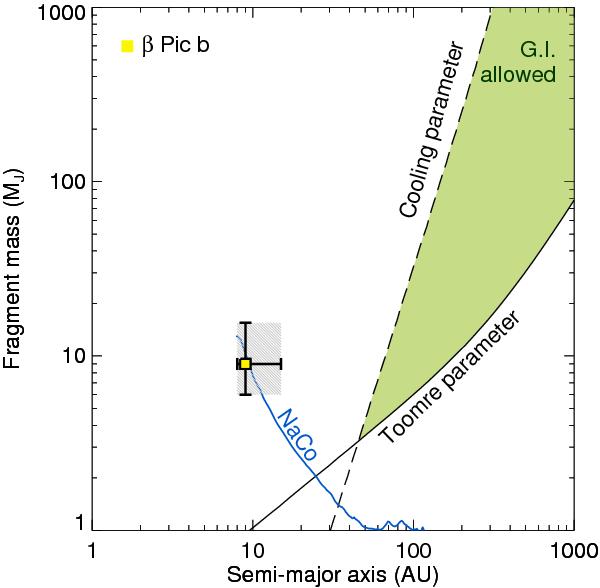
Disk instability model predictions for β Pictoris. The lower solid curve corresponds to the Toomre criterion which excludes the formation of planets below it. The upper dashed curve corresponds to the cooling criteria which only allows disk fragmentation below it. The allowed formation space is in between. The 1D average detection limit curve has been overplotted (blue solid line) but with a projected separation. The location of β Pictoris b has been overplotted on the graph with the new error bars from Bonnefoy et al. (2013).
Current usage metrics show cumulative count of Article Views (full-text article views including HTML views, PDF and ePub downloads, according to the available data) and Abstracts Views on Vision4Press platform.
Data correspond to usage on the plateform after 2015. The current usage metrics is available 48-96 hours after online publication and is updated daily on week days.
Initial download of the metrics may take a while.