Fig. 10
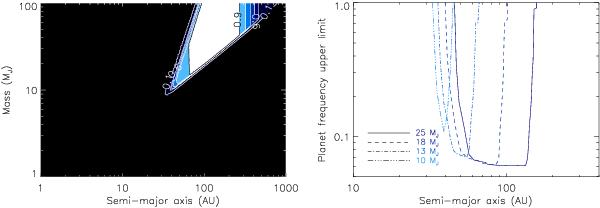
Left: mean detection probability map of the A-F sample as function of the mass and semi-major axis of the substellar companion. A uniform grid distribution has been used to generate the population, but the formation limits derived from the gravitational instability models excludes for each star the planets that do not fulfill both criteria. The detection maps from LOCI and nADI algorithms were used with COND03 (Baraffe et al. 2003) evolutionary models to convert from contrast to mass. Contour lines are regular from 0.5 to 0.9 plus one at 0.1. Right: corresponding estimate of the upper limit, with a confidence level of 95%, on the fraction of stars from the A-F sample that harbor at least one object companion in the same semi-major axis range. The curves for 25 MJ, 18 MJ, 13 MJ, and 10 MJ have been plotted since lower mass planets are not allowed to form via the disk instability mechanism.
Current usage metrics show cumulative count of Article Views (full-text article views including HTML views, PDF and ePub downloads, according to the available data) and Abstracts Views on Vision4Press platform.
Data correspond to usage on the plateform after 2015. The current usage metrics is available 48-96 hours after online publication and is updated daily on week days.
Initial download of the metrics may take a while.