Fig. 2
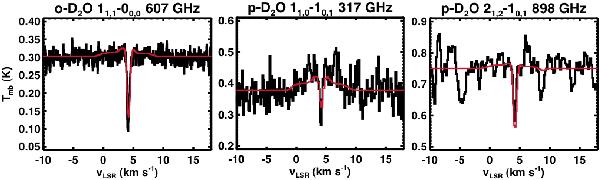
In black: D2O transitions observed with HIFI and JCMT. The CH3OD (70–60+) transition at 316.795074 GHz contaminating the para−D2O (11,0 − 10,1) line profile has been subtracted for a direct comparison with the D2O best-fit model. In red: best-fit model obtained when adding an absorbing layer with N(para–D2O) = 1.1 × 1012 cm-2 and N(ortho–D2O) = 1.4 × 1012 cm-2. The resulting inner abundance is 7 × 10⁻¹⁰ and the outer abundance is 5 × 10-12.
Current usage metrics show cumulative count of Article Views (full-text article views including HTML views, PDF and ePub downloads, according to the available data) and Abstracts Views on Vision4Press platform.
Data correspond to usage on the plateform after 2015. The current usage metrics is available 48-96 hours after online publication and is updated daily on week days.
Initial download of the metrics may take a while.