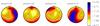
Fig. 8
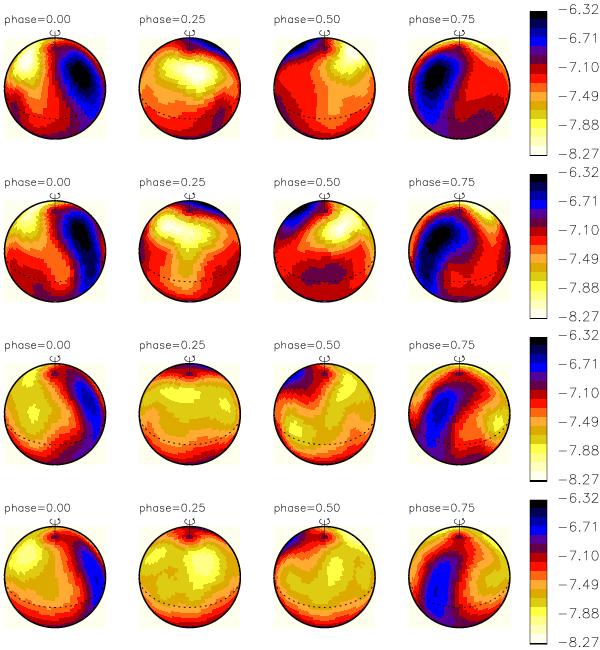
Doppler maps of HD 11753 obtained from CORALIE data simultaneously from Y ii 4398.013 Å, 4900.120 Å, 5200.405 Å, and 5662.929 Å lines. Epochs of the maps are from top to bottom: October 2000, December 2000, August 2009, and January 2010. The surface distribution is shown for four different phases 0.25 apart. The maps from the year 2000 have already been published in Paper I, but here they are shown using four Y ii lines simultaneously, using a refined regularisation parameter, and the newly determined period. The abundance scale for different epochs is the same.
Current usage metrics show cumulative count of Article Views (full-text article views including HTML views, PDF and ePub downloads, according to the available data) and Abstracts Views on Vision4Press platform.
Data correspond to usage on the plateform after 2015. The current usage metrics is available 48-96 hours after online publication and is updated daily on week days.
Initial download of the metrics may take a while.