Fig. 5
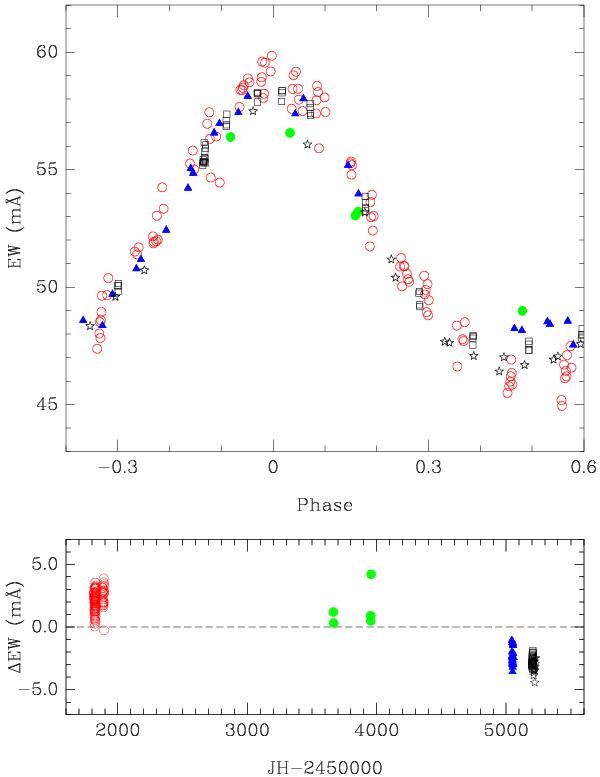
Equivalent width of Y ii lines. The average of seven Y ii lines is plotted for different epochs: CORALIE 2000 (open circles), FEROS 2005−2006 (filled circles), CORALIE 2009 (triangles), HARPSpol 2010 (squares), and CORALIE 2010 (stars). Lower panel: secular variation of the mean equivalent width after removing the rotational modulation.
Current usage metrics show cumulative count of Article Views (full-text article views including HTML views, PDF and ePub downloads, according to the available data) and Abstracts Views on Vision4Press platform.
Data correspond to usage on the plateform after 2015. The current usage metrics is available 48-96 hours after online publication and is updated daily on week days.
Initial download of the metrics may take a while.