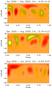
Fig. 28
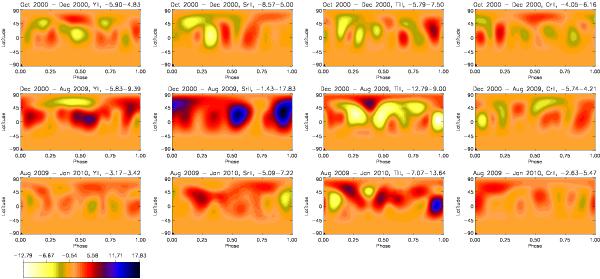
Significance of the changes between two consecutive epochs. The elements are from left to right: Y ii, Sr ii, Ti ii, and Cr ii. The figure gives standard deviation of the change for the following epochs: October 2000−December 2000, December 2000−August 2009, and August 2009−January 2010, from top to bottom. The original difference maps have been divided by the standard deviation of the difference for the October 2000 part1–part2 map, to present the significance of the changes. All the significance maps have the same scale, and the scale for each map is given in the title of the individual plot. Colour-coding is such that the dark colour indicates higher abundance in the first map from which the second map is subtracted; similarly, bright colour indicates lower abundance in the first map.
Current usage metrics show cumulative count of Article Views (full-text article views including HTML views, PDF and ePub downloads, according to the available data) and Abstracts Views on Vision4Press platform.
Data correspond to usage on the plateform after 2015. The current usage metrics is available 48-96 hours after online publication and is updated daily on week days.
Initial download of the metrics may take a while.