Free Access
Fig. 5
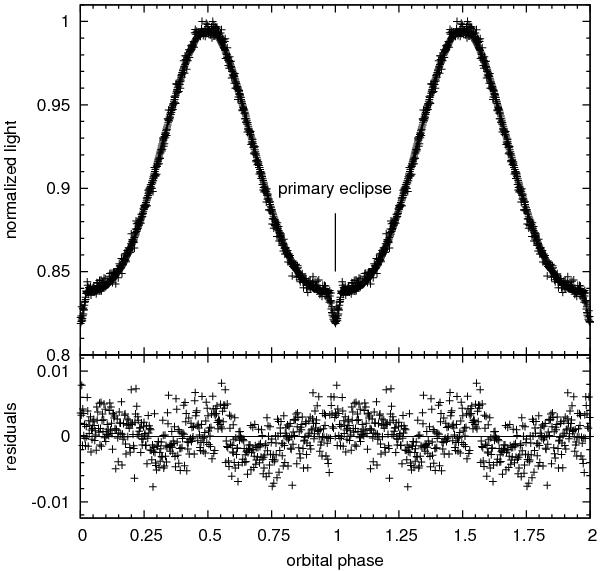
Phased SuperWASP lightcurve. The solid line demonstrates the best-fitting model. In the bottom panel the residuals can be seen. The wave pattern that is seen in the residuals can be explained by the simplified treatment of the reflection effect. Better models of the reflection effect should remove this wave pattern.
Current usage metrics show cumulative count of Article Views (full-text article views including HTML views, PDF and ePub downloads, according to the available data) and Abstracts Views on Vision4Press platform.
Data correspond to usage on the plateform after 2015. The current usage metrics is available 48-96 hours after online publication and is updated daily on week days.
Initial download of the metrics may take a while.