Fig. 7

Histogram with the resulting differences between the Hubble rate on the northern equatorial hemisphere HN and the southern equatorial hemisphere HS obtained from 16 000 runs of the distance modulus Monte Carlo. The red line indicates the measured value 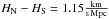 obtained from the SALT II data set. We also plotted a normal distribution
  with μ = 0.00 and σ = 1.07.
Current usage metrics show cumulative count of Article Views (full-text article views including HTML views, PDF and ePub downloads, according to the available data) and Abstracts Views on Vision4Press platform.
Data correspond to usage on the plateform after 2015. The current usage metrics is available 48-96 hours after online publication and is updated daily on week days.
Initial download of the metrics may take a while.