Fig. 12
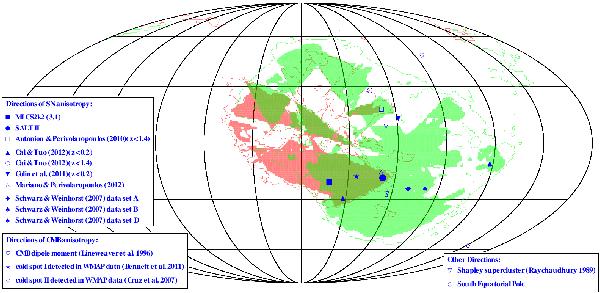
95% confidence level contours of the SALT II (green lines) and MLCS2k2(3.1) (red lines) maximum asymmetry directions (MLCS2k2 (3.1) ■, SALT II •) as well as 90% confidence level contours (filled green and filled red respectively, filled dark green where they coincide) compared with directions of anisotropies in SN data from Antoniou & Perivolaropoulos (2010) (z < 1.4) □, Cai & Tuo (2012) (z < 0.2 ▴, z < 1.4 °), Colin et al. (2011) (z < 0.2 ▾), Mariano & Perivolaropoulos (2012) ▵ and Schwarz & Weinhorst (2007) (data set A ◆, B ♣, D ♠), and with the direction of the CMB dipole moment ♡ (Lineweaver et al. 1996), the Shapley supercluster ▿ (Raychaudhury 1989), the cold spots I ★ (Bennett et al. 2011) and II detected in WMAP data ◇ (Cruz et al. 2007), and the South Equatorial Pole S.
Current usage metrics show cumulative count of Article Views (full-text article views including HTML views, PDF and ePub downloads, according to the available data) and Abstracts Views on Vision4Press platform.
Data correspond to usage on the plateform after 2015. The current usage metrics is available 48-96 hours after online publication and is updated daily on week days.
Initial download of the metrics may take a while.