Fig. 1
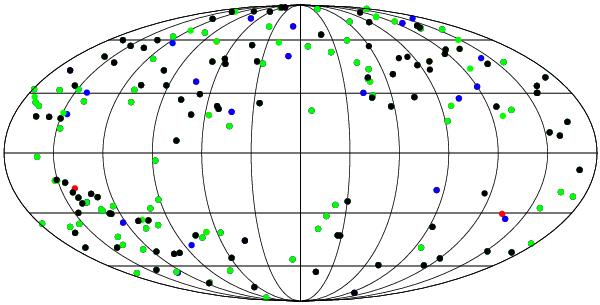
Celestial distribution of SNe from Hicken et al. (2009) having redshifts z < 0.2 in galactic coordinates. Black dots represent SNe, that are in all four samples, while green ones cannot be found in the SALT sample, blue ones are only in the MLCS2k2 samples. The MLCS2k2 (RV = 3.1) sample is the only subset, which contains red SNe. We plot in Mollweide projection.
Current usage metrics show cumulative count of Article Views (full-text article views including HTML views, PDF and ePub downloads, according to the available data) and Abstracts Views on Vision4Press platform.
Data correspond to usage on the plateform after 2015. The current usage metrics is available 48-96 hours after online publication and is updated daily on week days.
Initial download of the metrics may take a while.