Fig. 9
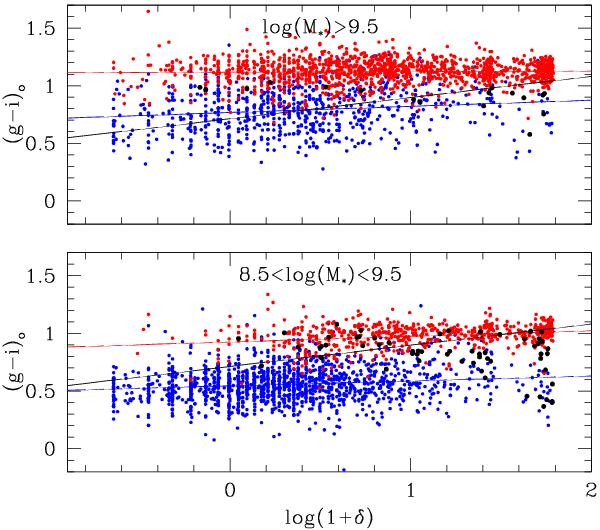
Blue and red sequence traced by the (g − i)o color as a function of the local galaxy density in two bins of stellar mass, below (bottom) and above (top) log (M∗) = 9.5. Blue symbols mark LTGs, while ETGs are given with red symbols. The two populations are fitted separately (colored lines) and together (black line). The black points represent PSBs.
Current usage metrics show cumulative count of Article Views (full-text article views including HTML views, PDF and ePub downloads, according to the available data) and Abstracts Views on Vision4Press platform.
Data correspond to usage on the plateform after 2015. The current usage metrics is available 48-96 hours after online publication and is updated daily on week days.
Initial download of the metrics may take a while.