Fig. 8
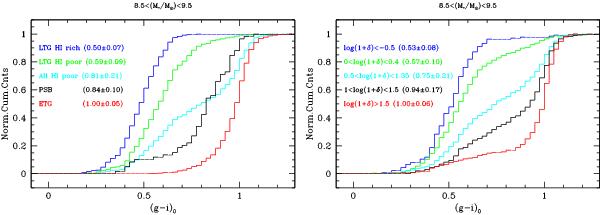
Cumulative distributions of the (g − i)o color in the interval 8.5 < log (M∗/M⊙) < 9.5, in the bins of morphological type/HI content (left panel) defined in Sect. 3.3 and in bins of local galaxy density (right panel). In parenthesis the median (g − i)o color with uncertainty is given. Notice the similarity between the distributions in the two panels.
Current usage metrics show cumulative count of Article Views (full-text article views including HTML views, PDF and ePub downloads, according to the available data) and Abstracts Views on Vision4Press platform.
Data correspond to usage on the plateform after 2015. The current usage metrics is available 48-96 hours after online publication and is updated daily on week days.
Initial download of the metrics may take a while.