Fig. 7
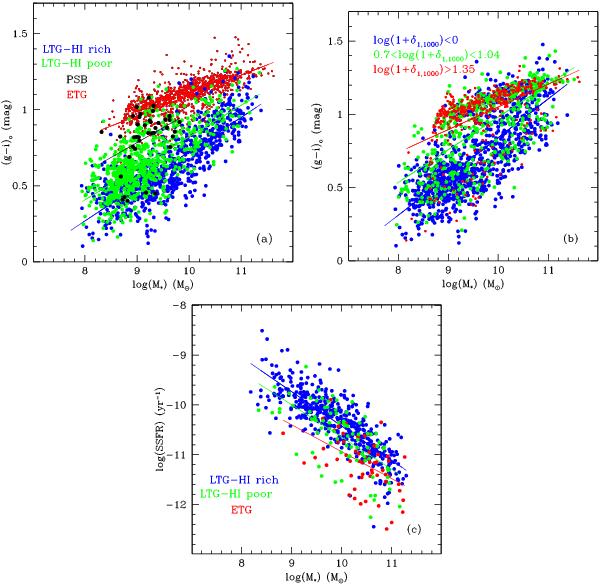
Four-step sequence of galaxies of increasing (g − i)o color is identified in the color-mass diagram of panel a) when four groups of different morphological types/gas-content/nuclear properties are considered. Panel a) corrected color (g − i)o vs. stellar mass diagram of optically selected galaxies of all morphological types. Red symbols represent ETGs. Green symbols represent HI-poor LTGs not detected by ALFALFA, while HI-rich LTGs detected by ALFALFA are given in blue. Large black symbols represent PSB (also named k+a, i.e., with Balmer lines in absorption) galaxies identified by Gavazzi et al. (2010). They all lie at log (M∗/M⊙) < 10. Panel b) a similar gradual trend in the color-mass diagram is found when galaxies are grouped in bins of increasing local density. This panel shows the corrected color (g − i)o vs. stellar mass diagram of optically selected galaxies of all morphological types, in three bins of decreasing local density: red = log (1 + δ1,1000) > 1.35, green = 0.7 < log (1 + δ1,1000) < 1.04; blue = log (1 + δ1,1000) < 0. Panel c) the specific star formation rate (SSFR) vs. stellar mass diagram of galaxies covered by ALFALFA and followed-up by Hα3. Galaxies are color-coded according to the following criterion: red = ETGs; green = LTGs undetected by ALFALFA (HI-poor); blue = LTGs detected by ALFALFA (HI-rich). Unsurprisingly, the statistics are very poor among ETGs and for HI-poor LTGs.
Current usage metrics show cumulative count of Article Views (full-text article views including HTML views, PDF and ePub downloads, according to the available data) and Abstracts Views on Vision4Press platform.
Data correspond to usage on the plateform after 2015. The current usage metrics is available 48-96 hours after online publication and is updated daily on week days.
Initial download of the metrics may take a while.