Free Access
Fig. 3
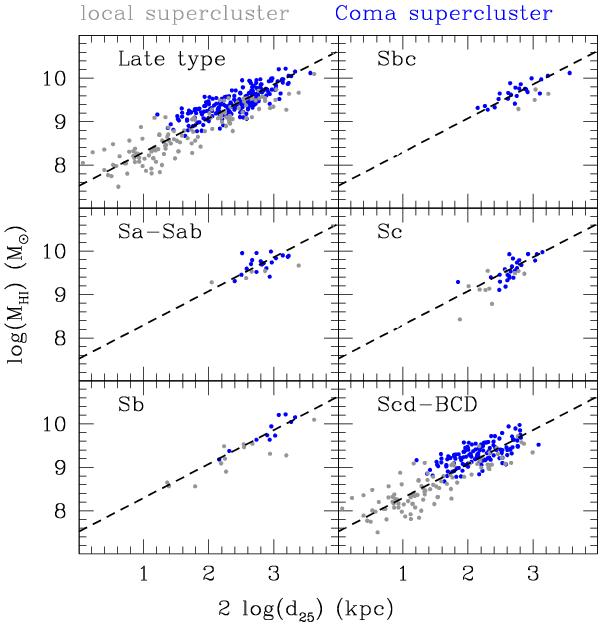
log MHI(T,D25) relation for isolated galaxies with δ1,1000 < 0 in the Coma supercluster (blue) and in the Local Supercluster (Paper II; gray). The fit obtained using all late-type (Sa-BCD) objects is given as a dashed line in every panel.
Current usage metrics show cumulative count of Article Views (full-text article views including HTML views, PDF and ePub downloads, according to the available data) and Abstracts Views on Vision4Press platform.
Data correspond to usage on the plateform after 2015. The current usage metrics is available 48-96 hours after online publication and is updated daily on week days.
Initial download of the metrics may take a while.