Fig. 2
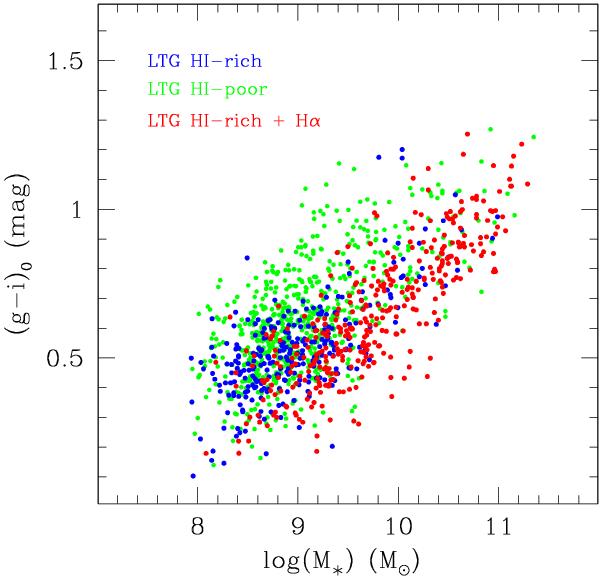
Corrected color (g − i)o vs. stellar mass diagram of optically selected galaxies limited to LTGs (subsample 2). The colors are corrected for extinction in the Milky Way and for internal extinction according to the prescriptions of Appendix A. LTGs undetected by ALFALFA are represented by green symbols. LTGs detected by ALFALFA are given in blue. Red symbols denote the subsample of the ALFALFA-selected galaxies that were followed-up in Hα3.
Current usage metrics show cumulative count of Article Views (full-text article views including HTML views, PDF and ePub downloads, according to the available data) and Abstracts Views on Vision4Press platform.
Data correspond to usage on the plateform after 2015. The current usage metrics is available 48-96 hours after online publication and is updated daily on week days.
Initial download of the metrics may take a while.