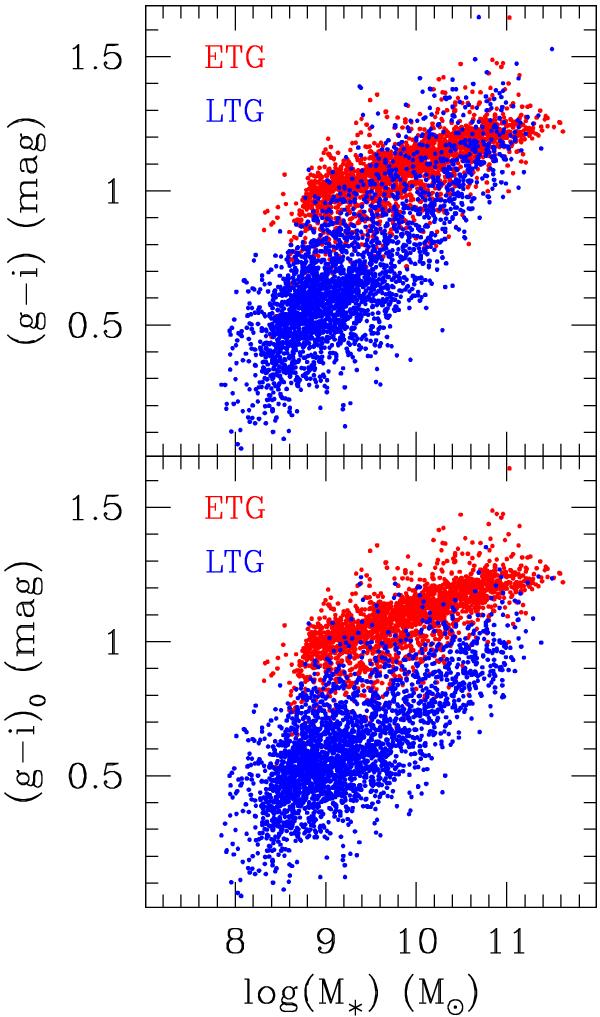
Fig. A.1

Top: observed color (g − i)-stellar mass diagram of all 5026 optically selected galaxies from SDSS (subsamples 1+2) divided by morphological types: ETGs (dE-S0a, red), LTG (Sa-Im-BCD, blue). Many high-mass LTGs overlap with, or are even redder than, ETGs of similar mass. Bottom: same as above but (g − i)o is corrected for inclination as described in this appendix. The correction is visible at high mass where LTGs have now bluer colors than ETGs. The blue and red sequence become more parallel and a significant green valley opens up between them.
Current usage metrics show cumulative count of Article Views (full-text article views including HTML views, PDF and ePub downloads, according to the available data) and Abstracts Views on Vision4Press platform.
Data correspond to usage on the plateform after 2015. The current usage metrics is available 48-96 hours after online publication and is updated daily on week days.
Initial download of the metrics may take a while.


