Fig. 12
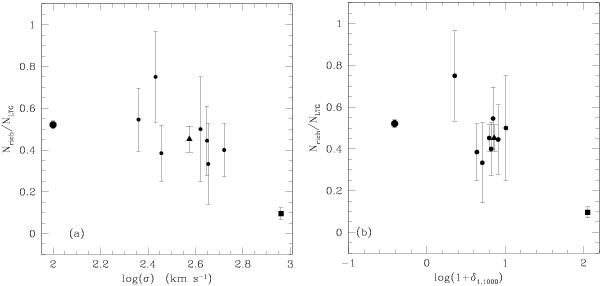
The number ratio of HI-rich LTGs over all LTGs as a function of the velocity dispersion (panel a)) and of the local density (panel b)) of 7 groups (small dots) and their average (triangle), the Coma cluster (square) and the field (large dot). The last point has been plotted at 100σ = km s-1 to represent that, even in the field, galaxies are subject to random motions.
Current usage metrics show cumulative count of Article Views (full-text article views including HTML views, PDF and ePub downloads, according to the available data) and Abstracts Views on Vision4Press platform.
Data correspond to usage on the plateform after 2015. The current usage metrics is available 48-96 hours after online publication and is updated daily on week days.
Initial download of the metrics may take a while.