Free Access
Fig. 10
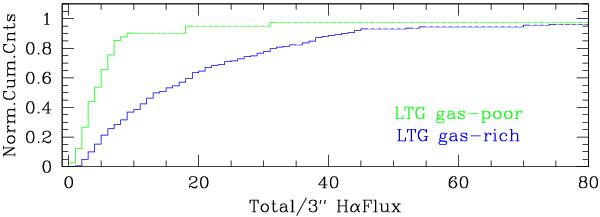
Cumulative distribution of the ratio of total Hα flux to Hα flux measured in a central 3-arcsec aperture in the imaging material. The blue histogram refers to LTGs detected in ALFALFA (HI-rich) and the green one depicts LTGs not detected in ALFALFA (HI-poor).
Current usage metrics show cumulative count of Article Views (full-text article views including HTML views, PDF and ePub downloads, according to the available data) and Abstracts Views on Vision4Press platform.
Data correspond to usage on the plateform after 2015. The current usage metrics is available 48-96 hours after online publication and is updated daily on week days.
Initial download of the metrics may take a while.