Fig. 1
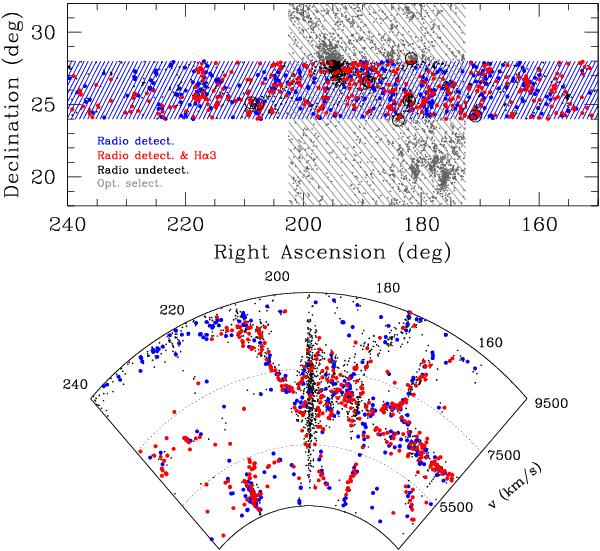
Top panel: sky distribution (the RA scale is compressed) of the Coma supercluster area studied in this work, constituted by the union of the traditional area occupied by the Coma supercluster 172° < RA < 202°; 18° < Dec < 32° (region 1, gray shaded) with the elongated region 150° < RA < 240°; 24° < Dec < 28° (region 2, blue shaded) covered by ALFALFA (Haynes et al. 2011). In both regions only galaxies in the interval 3900 < cz < 9500 km s-1 are considered. Sample 1 includes 5026 galaxies of all morphological types optically selected from SDSS (small black dots) in the union of regions 1+2. Sample 2 includes 683 galaxies HI selected from ALFALFA (blue symbols). Sample 3 (a subset of sample 2) is composed of 383 galaxies followed-up with Hα observations as part of Hα3 (red symbols). Region 1 will be fully covered by ALFALFA in the near future. Currently, only the brightest galaxies have been observed in HI and in Hα with pointed observations (listed in GOLDmine). Black circles mark the position of the seven groups found in region 2. Bottom panel: recessional velocity versus RA distribution of 2416 galaxies in the region 2 covered by ALFALFA (black). 683 galaxies detected by ALFALFA are represented in blue. The 383 galaxies observed in Hα as part of Hα3 are plotted in red. Note the filamentary structure departing from the Coma cluster (identified by the “finger of God” near RA = 195), with increasing velocity toward the Hercules supercluster (RA = 240).
Current usage metrics show cumulative count of Article Views (full-text article views including HTML views, PDF and ePub downloads, according to the available data) and Abstracts Views on Vision4Press platform.
Data correspond to usage on the plateform after 2015. The current usage metrics is available 48-96 hours after online publication and is updated daily on week days.
Initial download of the metrics may take a while.