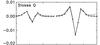
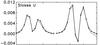
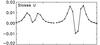
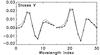
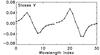
Fig. 15
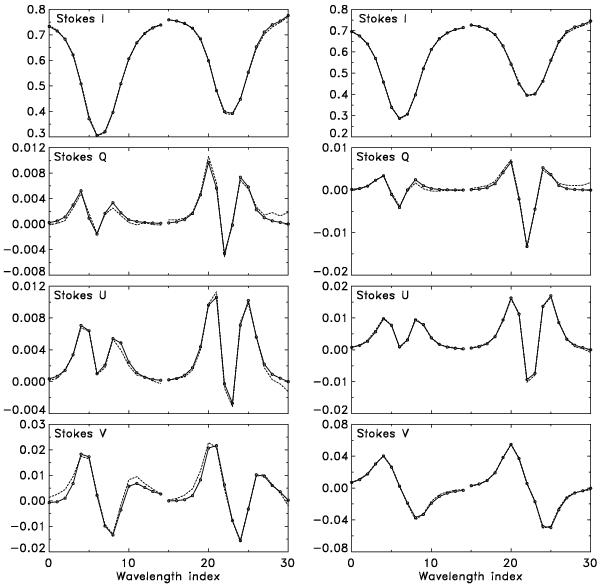
Observed (solid) and fitted synthetic (dashed) 630.15/ 630.25 nm Stokes profiles from within the limb side penumbra shown in Fig. 14. The left column shows the averaged profiles from all opposite polarity pixels (marked with red color in Fig. 14). Note the abnormal Stokes V profile with 3 lobes, where the third “extra” lobe appears in the red wings of the lines, and that the abnormal Stokes V profile is fitted reasonably well by the inversions. The right column shows the averaged profiles from all other pixels within the same subfield, for which the average Stokes V profile is normal. The line profiles (plotted side by side) are normalized to the average continuum intensity outside the spot.
Current usage metrics show cumulative count of Article Views (full-text article views including HTML views, PDF and ePub downloads, according to the available data) and Abstracts Views on Vision4Press platform.
Data correspond to usage on the plateform after 2015. The current usage metrics is available 48-96 hours after online publication and is updated daily on week days.
Initial download of the metrics may take a while.