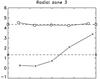
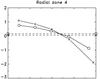
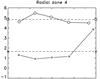
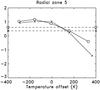
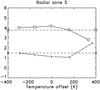
Fig. 10
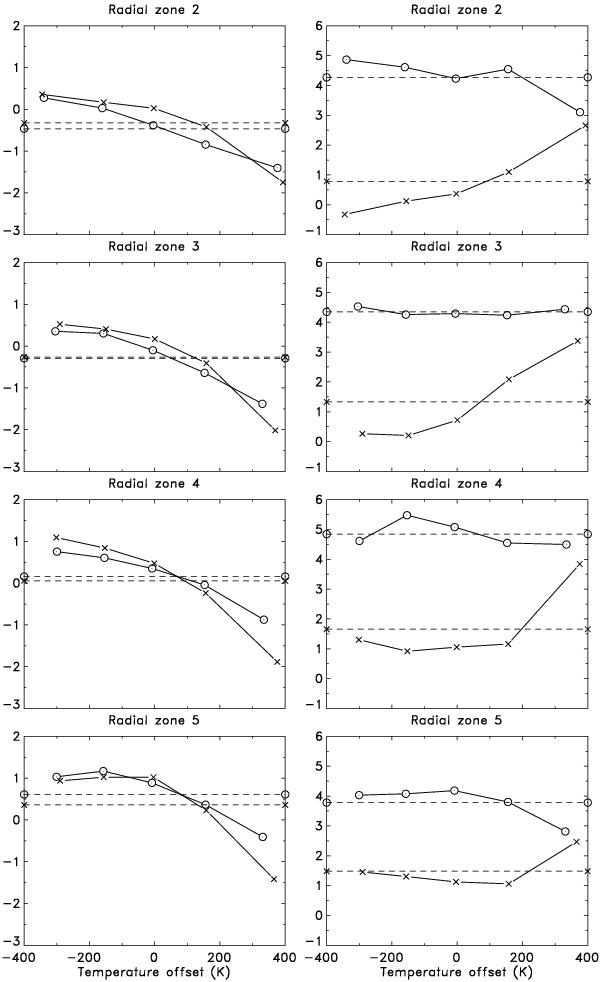
Variation of vertical (left column) and radial outflow (right column) velocities with local (high-pass spatially filtered) temperature fluctuations, obtained by fitting the azimuthal variations of the inferred LOS velocities at τc = 0.95, and shown for radial zones 2–5. The vertical velocities show the expected convective signature: the relatively cool component has downflows of up to 1.2 km s-1, the relatively hot gas upflows of up to − 1.3 km s-1. Radial velocities are strong in the intra-spines (circles) and weak in the spines (X-symbols), but the hottest spine structures show radial outflows in excess of 3 km s-1.
Current usage metrics show cumulative count of Article Views (full-text article views including HTML views, PDF and ePub downloads, according to the available data) and Abstracts Views on Vision4Press platform.
Data correspond to usage on the plateform after 2015. The current usage metrics is available 48-96 hours after online publication and is updated daily on week days.
Initial download of the metrics may take a while.