Fig. 1
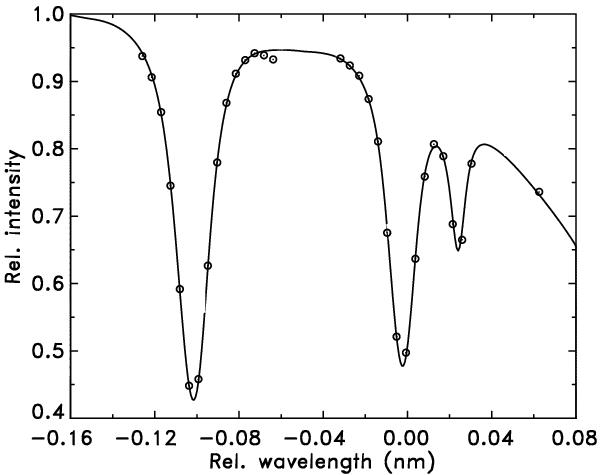
Observed flatfield spectrum for a pixel near the center of the FOV (circles). The solid line shows the FTS atlas spectrum for the same wavelength range, convolved with the fitted CRISP transmission profile and multiplied with the fitted pre-filter transmission curve. The strength and position of the telluric blend have been determined in a separate fit (see text).
Current usage metrics show cumulative count of Article Views (full-text article views including HTML views, PDF and ePub downloads, according to the available data) and Abstracts Views on Vision4Press platform.
Data correspond to usage on the plateform after 2015. The current usage metrics is available 48-96 hours after online publication and is updated daily on week days.
Initial download of the metrics may take a while.