Fig. 4
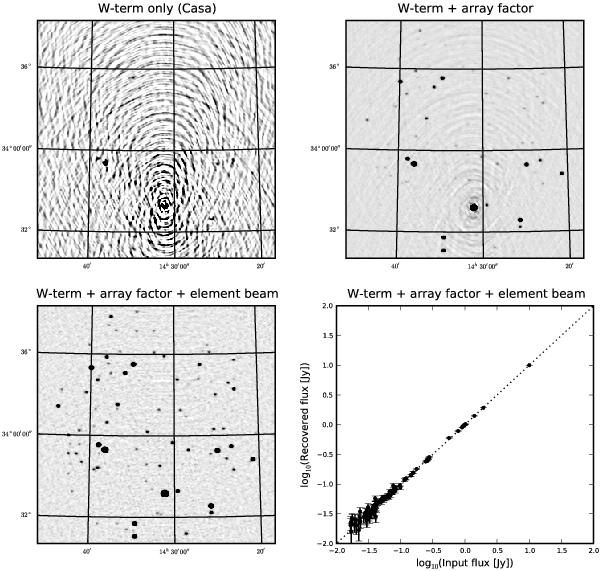
Dramatic differences between the estimated deconvolved sky when using three different modified CLEAN algorithms on a simulated dataset containing 100 sources. The visibilities have been generated by taking (i) the individual antennas; (ii) their projection on the sky and (iii) the beam-forming step (the scalar array factor) into account. The top-left image shows the deconvolved sky as estimated with a traditional imager not taking time, frequency, baseline, direction-dependent effects into account. The top right and lower left images have been generated by considering, respectively, the array factor only and both the array factor and the element beam. The lower right panel shows that the input flux densities are correctly recovered.
Current usage metrics show cumulative count of Article Views (full-text article views including HTML views, PDF and ePub downloads, according to the available data) and Abstracts Views on Vision4Press platform.
Data correspond to usage on the plateform after 2015. The current usage metrics is available 48-96 hours after online publication and is updated daily on week days.
Initial download of the metrics may take a while.