Fig. 3
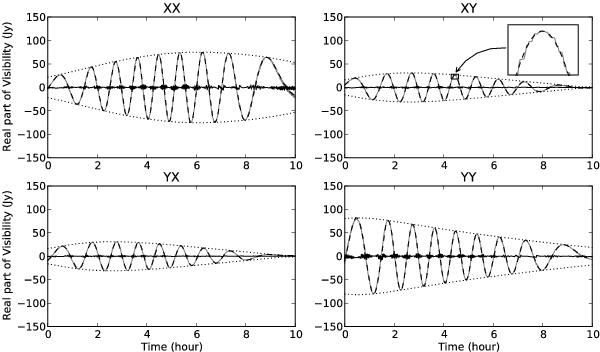
Essential part of the A-Projection algorithm relies on the predict step, which transforms a 2D sky image (the projection of the celestial sphere on a plane) into a set of visibilities. We have simulated a dataset having one off-axis source, where the true visibilities (black dashed line) have been estimated using Eq. (1), taking the beam into account. This plot shows the comparison in all measured polarizations between the exact value of the visibility of a given baseline and the A-Projection estimate (gray line). Contrary to a traditional predict step, the visibilities are modulated by the beam amplitude (dotted line), and we have time-dependent polarization leakage. The overplotted graph shows a zoom in the small region shown in the top-right panel. In the degridding step, we use a computationally efficient closest-neighbor interpolation, creating steps in the predicted visibilities.
Current usage metrics show cumulative count of Article Views (full-text article views including HTML views, PDF and ePub downloads, according to the available data) and Abstracts Views on Vision4Press platform.
Data correspond to usage on the plateform after 2015. The current usage metrics is available 48-96 hours after online publication and is updated daily on week days.
Initial download of the metrics may take a while.