| Issue |
A&A
Volume 553, May 2013
|
|
|---|---|---|
| Article Number | A30 | |
| Number of page(s) | 8 | |
| Section | Stellar structure and evolution | |
| DOI | https://doi.org/10.1051/0004-6361/201220862 | |
| Published online | 25 April 2013 | |
CoRoT 101186644: A transiting low-mass dense M-dwarf on an eccentric 20.7-day period orbit around a late F-star⋆
Discovered in the CoRoT lightcurves
1
School of Physics and Astronomy, Raymond and Beverly Sackler Faculty of
Exact Sciences, Tel Aviv University,
69978
Tel Aviv,
Israel
e-mail:
levtalo@post.tau.ac.il
2
Observatoire de l’Université de Genève,
51 chemin des Maillettes,
1290
Sauverny,
Switzerland
3
Instituto de Astrofísica de Canarias, 38205, La Laguna, Tenerife, Spain
4
Universidad de La Laguna, Dept. de Astrofísica, 38200
La Laguna, Tenerife,
Spain
5
Institut d’Astrophysique de Paris, UMR 7095, CNRS, Université
Pierre & Marie Curie, 98bis Bd Arago, 75014
Paris,
France
6
Observatoire de Haute Provence, CNRS/OAMP,
04870 St. Michel l’Observatoire,
France
7
Institute of Planetary Research, German Aerospace Centre, Rutherfordstrasse 2,
12489
Berlin,
Germany
8
Aix-Marseille Université, CNRS, LAM (Laboratoire d’Astrophysique
de Marseille), UMR 7326, 13388
Marseille,
France
9
Research and Scientific Support Department,
ESTEC/ESA, Keplerlaan 1,
2200 AG
Noordwijk, The
Netherlands
10
Leiden Observatory, Leiden University,
PO Box 9513, 2300 RA
Leiden, The
Netherlands
Received: 6 December 2012
Accepted: 6 February 2013
We present the study of the CoRoT transiting planet candidate 101186644, also named LRc01_E1_4780. Analysis of the CoRoT lightcurve and the HARPS spectroscopic follow-up observations of this faint (mV = 16) candidate revealed an eclipsing binary composed of a late F-type primary (Teff = 6090 ± 200 K) and a low-mass, dense late M-dwarf secondary on an eccentric (e = 0.4) orbit with a period of ~20.7 days. The M-dwarf has a mass of 0.096 ± 0.011 M⊙, and a radius of 0.104-0.006+0.026 R⊙, which possibly makes it the smallest and densest late M-dwarf reported so far. Unlike the claim that theoretical models predict radii that are 5–15% smaller than measured for low-mass stars, this one seems to have a radius that is consistent and might even be below the radius predicted by theoretical models.
Key words: planetary systems / stars: individual: CoRoT 101186644 / binaries: eclipsing / techniques: photometric / techniques: radial velocities
Based on observations made with the 1-m telescope at the Wise Observatory, Israel, the Swiss 1.2-m Leonhard Euler telescope at La Silla Observatory, Chile, the IAC-80 telescope at the Observatory del Teide, Canarias, Spain, and the 3.6-m telescope at La Silla Observatory (ESO), Chile (program 184.C-0639).
© ESO, 2013
1. Introduction
CoRoT is the first space-mission to search for transiting extrasolar planets (Baglin et al. 2009; Auvergne et al. 2009; Deleuil et al. 2011). Since its launch in December 2006, 26 transiting planets have been discovered, and many other candidates await confirmation (Pätzold et al. 2012; Grziwa et al. 2012). The discovery process of a new transiting planet includes careful analysis of the lightcurve (Carpano et al. 2009), as well as photometric and spectroscopic follow-up observations (Deeg et al. 2009; Bouchy et al. 2009; Santerne et al. 2011).
Lightcurves with periodic transit-like signals caused by phenomena other than a transiting planet are usually referred to as “false positives” or “false alarms” (e.g., Brown 2003; Santerne et al. 2012). In the CoRoT sample, for instance, the main source of such alarms are eclipsing binary systems in various configurations (Almenara et al. 2009). Recently, however, such systems are becoming objects of interest in and of themselves (e.g., Pont et al. 2005a; Tal-Or et al. 2011).
Eclipsing binaries (EBs) with low mass ratios, like M dwarfs that eclipse A–K dwarfs, draw particular attention (e.g., Bentley et al. 2009; Triaud et al. 2013). The high-quality photometric and spectroscopic data produced for these systems by photometric surveys like HAT (Bakos et al. 2004), WASP (Pollacco et al. 2006), CoRoT, Kepler (Borucki et al. 2010), and their follow-up programs, allow for precise determination of physical properties, such as the masses and the radii of both components. This in turn enables addressing fundamental problems, such as the M-dwarf radius problem: the claim that theoretical models predict 5−15% smaller radii than measured for low-mass stars (e.g., Torres et al. 2010; Morales et al. 2010; Kraus et al. 2011, and references therein).
This paper presents the study of the CoRoT transiting-planet candidate CoRoT 101186644 (Cabrera et al. 2009), also named LRc01_E1_4780. The CoRoT lightcurve and the HARPS spectroscopic follow-up observations have led to the conclusion that LRc01_E1_4780 (=C4780) is an eclipsing binary composed of a late F-type primary and a low-mass dense M-dwarf secondary star on an eccentric (e = 0.4) orbit with a period of ~20.7-days.
Section 2 gives some details about the star and presents the CoRoT lightcurve. Section 3 describes the ground-based follow-up observations we performed. Section 4 presents our analysis of the available data to derive the main physical parameters of the system. The astrophysics of the secondary is discussed in Sect. 5 within the context of the M-dwarf radius problem. Finally, Sect. 6 presents some more general conclusions.
Coordinates and magnitudes of C4780 and of the main contaminator in its CoRoT-photometric mask.
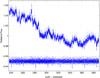 |
Fig. 1 C4780 lightcurve normalized by its median flux value. Top: the original lightcurve. Bottom: the detrended lightcurve moved down by 0.05, for clarity. |
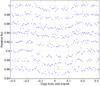 |
Fig. 2 The 8 transit-like events detected by CoRoT in C4780, each moved to its own timeframe (i.e. (n·P + T0) days were subtracted from the time stamp of each point, where n is the transit number, T0 = 2 454 240.3147 BJD, and P = 20.6837). Subsequent events were moved down by 0.02 for clarity. |
2. The CoRoT lightcurve
C4780 was observed by CoRoT during the LRc01 run from May 19, 2007 to Oct. 12, 2007. Table 1 lists some basic information on its stellar properties. Since it is a relatively faint star, only monochromatic photometric data were recorded. Eight transit-like events with a depth of ~0.86% and a period (P) of 20.684 days were detected in the lightcurve (Cabrera et al. 2009). It was therefore identified as an interesting candidate for a Jovian planet residing in the so-called “period valley” (e.g., Jones et al. 2003; Udry et al. 2003).
Figure 1 shows the original and detrended lightcurves of C4780, both normalized by their median flux value. Figure 2 zooms on the eight transit-like events detected by CoRoT in the lightcurve, each shifted to its own timeframe. Stellar and systematic variability were removed from each transit by fitting a third-degree polynomial to the out-of-transit points.
3. Ground-based follow-up observations
As for other CoRoT transiting-planet candidates, we performed a sequence of follow-up observations to understand the true nature of C4780. Photometric observations were done to verify that the transits indeed occur on the main star inside the large-area photometric mask of CoRoT. Using spectroscopic observations we tried to distinguish it from other possible false-alarm scenarios. Together with the CoRoT lightcurve, these observations were used in determining the system’s nature as an eclipsing binary system and in deriving its main physical parameters.
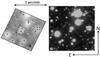 |
Fig. 3 Images of the sky around C4780 (the star is at the center). Right: R-filter image taken on August 9, 2010, by the 1-m Wise Observatory telescope, Israel. Left: image taken by CoRoT, at the same scale and orientation. The rectangular line at the center outlines the CoRoT-photometric mask. Positions of nearby stars are indicated by small crosses. |
3.1. Photometric observations
Figure 3 shows images of the sky around C4780, taken by CoRoT and by the 1-m Wise Observatory telescope, Israel. It can be seen that, in addition to C4780, the CoRoT-photometric mask contains at least three fainter stars, but only two of them are bright enough and fully contained in the mask to be able to cause the ~1% transit-like signals – the two stars ~6′′ south-southeast of C4780. The brighter of the two (CoRoT ID 101186975) is fainter than C4780 by 2.9 ± 0.3 mag in the r’-filter (see Table 1), while its close neighbor is fainter than C4780 by 4.2 ± 0.5 mag in the R-filter, as measured using the Wise Observatory data. The contamination level inside the mask is thus ~10%.
ON-OFF observations of C4780, in which short timeseries during a transit and outside of it are observed and compared photometrically (Deeg et al. 2009), were performed during August 2010 using the 1-m telescope at the Wise Observatory, Israel, and the Swiss 1.2-m Leonhard Euler Telescope at La Silla Observatory, Chile. Both observations indicated that the transits occur on the main target in the mask – C4780 – and not on one of the two contaminators.
In an effort to recover its ephemeris, C4780 was observed again on May 27, 2011, using the IAC-80 telescope at the Observatory del Teide, Canarias, Spain, and the Swiss 1.2-m Leonhard Euler telescope at La Silla Observatory, Chile. A clear ingress was detected in these observations, which permitted the refinement of the period estimation to 20.68369 ± 0.00011 days.
3.2. HARPS spectra and radial velocities
Spectroscopic observations of C4780 were done with the HARPS spectrograph (Mayor et al. 2003) mounted at the 3.6-m ESO telescope, Chile, as part of the ESO large program 184.C-0639. HARPS was used with the observing mode obj_AB, in which the background-sky spectra were recorded using the second fiber (fiber B). Overall nine spectra were recorded between June 21, 2008 and July 20, 2010 with exposure times of 45–60 min. The HARPS data were reduced with the online standard pipeline (Baranne et al. 1996; Pepe et al. 2002). The signal-to-noise ratio (S/N) per pixel at 550 nm is in the range of 2–6.3, since C4780 is on the faint end in magnitude for HARPS. Radial velocities were obtained by performing weighted cross-correlation with a numerical G2 mask. The derived radial velocities (RVs) are given in Table 2.
HARPS spectra and RVs (in km s-1) of C4780.
The spectra were also analyzed with TODMOR (e.g., Zucker & Mazeh 1994; Zucker et al. 2003, 2004), a two-dimensional correlation algorithm customized for detecting faint-secondary companion in a spectrum. However, the signature of neither the secondary in C4780 (=C4780 B) nor any other stellar contaminant were detected.
To determine the fundamental atmospheric parameters of the primary in C4780 (=C4780 A), we used the method described by Bruntt et al. (2010b), which has become the standard method for characterizing CoRoT targets since CoRoT-3b (e.g., Deleuil et al. 2008; Fridlund et al. 2010). In this method the observed spectra are first co-added to create a single master spectrum, and then a synthesized spectrum is fitted to this master spectrum using either the Spectroscopy Made Easy (SME, Valenti & Piskunov 1996; Valenti & Fischer 2005) or the VWA (Bruntt et al. 2008) spectral analysis packages.
 |
Fig. 4 Three parts of the co-added HARPS spectrum of C4780 (blue), together with the fitted model spectrum (black). Top, middle, and bottom panels show 32 Å long parts of the spectrum, focused on the H α, Mg I b, and H β lines, respectively. |
Parameters from ground-based observations.
The atmospheric parameters found this way are listed in Table 3. The relatively large uncertainties are a result of the low S/N of the spectra and the addition of possible systematic errors (see e.g., Bruntt et al. 2010a, 2012; Torres et al. 2012). Figure 4 shows three parts of the master spectrum of C4780, 32 Å long each, focused on the H α, H β, and Mg I b lines, together with the fitted model spectrum. The extended wings of Balmer lines can be used to constrain Teff, while log g of late-type stars can be determined from pressure-sensitive lines like Mg I b (Bruntt et al. 2010b).
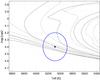 |
Fig. 5 Two sets of Y2 stellar isochrones from Demarque et al. (2004), one for [Fe/H] = 0.05 (solid lines) and one for [Fe/H] = 0.39 (dashed lines). Both sets are for [α/Fe] = 0 and ages of 0.2, 0.4, 1, 2, 4, 8, and 10 Gyr (going from left to right along the log g = 4.3 line). The estimated Teff and log g of C4780 A are marked by a star and their uncertainties are marked by an ellipse. |
4. System parameters
4.1. Isochrone fitting
The primary mass and the system’s age were estimated using the atmospheric parameters derived from the HARPS spectra and a grid of Y2 stellar isochrones (Yi et al. 2001; Demarque et al. 2004). This was done by taking into account all age and mass values that fall into the ellipsoid in the (Teff, log g, [Fe/H]) space defined by the atmospheric parameters and their errors. To illustrate the process Fig. 5 shows two sets of Y2 stellar isochrones of 0.2–10 Gyr, one for [Fe/H] = 0.05 and one for [Fe/H] = 0.39. The ellipse defined by the estimated Teff, log g, and their uncertainties is also shown. A lower limit of 0.2 Gyr on the age was set to ignore possible pre-main sequence solutions. This procedure yielded a mass estimate of 1.21 ± 0.10 M⊙ and an upper limit of ~7 Gyr for the system’s age (at a 2σ confidence level). Following Basu et al. (2012) we have conservatively doubled the mass errors to take possible uncertainties in stellar model parameters into account.
The consistency between the atmospheric parameters derived from the HARPS spectra and the broad-band photometry (listed in Table 1) was also checked. This was done by fitting the distance and extinction to minimize the χ2 between each isochrone point, which also contains predictions for the true MV and color values, and the observed magnitudes. ExoDat and 2MASS magnitudes were translated to the systems used in the isochrones using the relations given by Deleuil et al. (2009) and Carpenter (2001). The average extinction law (RV = 3.1) of Savage & Mathis (1979) were assumed, together with the Cardelli et al. (1989) total-to-selective extinction ratios. The parameters were derived taking all model-points with  into account. Only isochrones with metallicity in the range allowed by the spectrum modeling (+ 0.2 ± 0.2) were considered. The results, given at the bottom of Table 3, are consistent with the parameters derived from the HARPS spectra.
Parameters of C4780 from the combined lightcurve and RV modeling.
4.2. MCMC analysis
The rest of the system parameters were derived by modeling the CoRoT lightcurve and the HARPS RV data simultaneously, using Markov chain Monte Carlo (MCMC) analysis (e.g., Tegmark et al. 2004, Appendix A). The MCMC run consisted of 106 accepted steps. The input data were the eight-transit data shown in Fig. 2, seven one-day-long parts of the detrended lightcurve where the secondary eclipses might have occurred, and the nine HARPS RVs. Errors for the photometric data were derived from the scatter of the out-of-transit points, which was found to be ~0.25%.
The model consisted of 12 free parameters – P, T0, Js, rt, k, L3, x, up, ecosω, esinω, K, and γ, all detailed in Table 4. A lower bound of 0.07 was set on L3 to fit the estimated contamination value (see Sect. 3.1), and up was constrained to be between 0.56 and 0.66 according to the values given in Sing (2010) and the atmospheric parameters derived from the HARPS spectra. Besides these two limitations, flat prior distributions were used.
At each MCMC step, the lightcurve model was calculated using EBOP (Popper & Etzel 1981), an algorithm for analyzing eclipsing-binary lightcurves, and the RV model was calculated using our own code for solving Kepler’s equation. The sizes of the MCMC Gaussian perturbations were set by a relatively short MCMC run (of ~105 accepted steps). The χ2 for each trial point was the sum of the lightcurve χ2 and the χ2 of the RV data. Following the Metropolis-Hastings algorithm, trial points with lower χ2 were accepted, whereas trial points with higher χ2 were accepted only with probability of exp(− Δχ2/2), assuming the observational errors to be Gaussian (Ford 2005).
Table 4 lists the parameters estimated by the MCMC analysis. For model parameters that showed normal posterior probability distribution, the median value of the chain is mentioned as our estimation. However, for model parameters with skewed distribution (the ones with uneven confidence limits in Table 4) the most probable value is mentioned as our estimation. For most of the parameters, the confidence limits were estimated as the range of values that cover the central 68.3% of the chain. The lower limits of L3 and up, however, were determined by the chosen priors, which indicates that the ground-based observations helped in this case for placing stronger constraints on these two limits. The orbital period estimated by the MCMC analysis is consistent with the one derived from photometric follow-up observations (see Table 3).
Figure 6 presents the phase-folded RV curve of C4780 with our best orbital solution, and Fig. 7 presents the phase-folded lightcurve and our best model. It can be seen that no secondary eclipse was detected. Given the typical noise (~0.25%) and the expected number of points inside the secondary eclipse (~100), the maximum depth of the secondary eclipse is ≲0.05% (1σ upper limit), which corresponds to a surface brightness ratio of Js ≲ 0.06.
Figure 8 shows the histograms of the 12 free parameters of the model, and Fig. 9 shows some correlation plots of parameter pairs that show non-zero correlation, both produced from the final MCMC chain. The most skewed histograms are those of L3, k, and rt. The most prominent (and obvious) correlation is between L3 and k. These facts reflect the difficulty of setting an upper limit for L3 directly from the photometric data, and as a consequence the difficulty of setting an upper limit for the secondary radius (even if the primary radius is known).
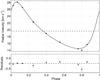 |
Fig. 6 RVs of C4780 as measured by HARPS. The solid line is the Keplerian model produced from the orbital parameters of Table 4, and the dashed line is the center-of-mass velocity. The residuals are plotted in the lower panel. Note the different scale. |
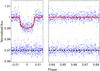 |
Fig. 7 The primary transit (left panel) and the part where the secondary eclipse should have occurred (right panel) in the phase-folded lightcurve of C4780. Our best model is overplotted with a solid red line. The residuals were moved up by 0.97 for clarity. |
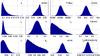 |
Fig. 8 Histograms of the 12 free parameters of the model from the final MCMC chain. |
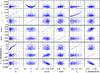 |
Fig. 9 Selected correlation plots of parameter pairs from the final MCMC chain. For clarity, only one of every 500 points of the chain was plotted. |
The secondary mass (M2) and both radii (R1 and R2) were estimated using the MCMC chain and the estimated mass of the primary (1.2 ± 0.2 M⊙) in the following manner:
-
For each point of the MCMC chain the primary mass function(f), inclination (i), and semimajor axis of the primary (a1) were calculated analytically.
-
A sample of 5000 M1 values, normally distributed according the M1 value found, was generated.
-
A subsample of 5000 points was taken from the MCMC chain by taking every 200th point of the chain.
-
For each M1 value of the selected sample and each of the selected MCMC points, the mass ratio (q) was calculated analytically, using the relation
 (1)The secondary mass (M2) was then calculated for each pair of M1 and q values, and the semimajor axis (a) was calculated for each set of M1, M2, and a1 values.
 -
Using Kepler’s third law and the definitions of rt and k (see Table 4) the primary radius (R1) can be expressed as
 (2)where G is the universal gravitational constant and P the orbital period. Using this expression, the primary and secondary radii (R1 and R2) were calculated analytically for each M1 value of the selected sample and each of the selected MCMC points. Given the mass and radius of the primary, its surface gravity (log g1) was also calculated.
The values and errors of all parameters calculated analytically (f, i, a, q, M2, R1, log g1, and R2) were estimated the same way as the values and errors of the free parameters of the model. These parameters are shown at the bottom part of Table 4. The highly uneven confidence limits of R2 reflect our choice of taking the most probable value as our estimate for model parameters with skewed distribution. The strong correlation between k and L3 (Fig. 9) shows that the estimated R2 value reflects our estimation of L3 to be ~10%. This contamination level agrees with the expected one, taking the contaminants inside the CoRoT-photometric mask (see Sect. 3.1) into account. It means that the adopted L3 value matches the nonexistence of any other, unresolved, luminous object close to C4780. This is also consistent with the nondetection of a secondary companion in the spectra with TODMOR (see Sect. 3.2).
5. Discussion
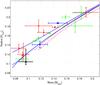 |
Fig. 10 Mass-radius diagram of VLMS (M ≲ 0.2 M⊙). The symbols represent observed stars, while the lines correspond to theoretical mass-radius relations. Red rectangles are secondary stars of main-sequence EBs, green circles are secondary stars of white dwarf + M-dwarf EBs, and blue diamonds are single stars (all references are given in Table 5). The black triangle stands for C4780 B. Solid blue lines correspond to theoretical isochrones of solar metallicity and ages of 0.25,1, and 5 Gyr (going from top to bottom along the 0.08 M⊙ line) from Baraffe et al. (1998). To illustrate the effect of metallicity on size dashed-red lines show the Dartmouth isochrones (Dotter et al. 2008) of 1 Gyr for [Fe/H] = 0.2 (upper line) and [Fe/H] = −0.5 (lower line). |
Many studies of eclipsing binaries with low-mass (0.2–0.8 M⊙) main-sequence stars indicated a disagreement between theoretical models and observational data. In particular, it has been claimed that the stellar radii computed from models in this mass domain are 5−15% lower than observed (e.g., López-Morales & Ribas 2005; Morales et al. 2010; Kraus et al. 2011). This argument is sometimes called the M-dwarf radius problem (e.g., Triaud et al. 2013), and it dates back to the precise masses and radii measurements of both components of CM Draconis (Lacy 1977). However, in the domain of very low-mass stars (VLMS, M ≲ 0.2 M⊙), only a few studies have been published (e.g., López-Morales 2007; Boyajian et al. 2012), since only a handful of precise masses and radii have been derived in this domain. The derivation of the mass and radius of C4780 B, albeit not a very accurate determination, is an opportunity to revisit the VLMS mass-radius relation.
In Fig. 10 we plotted the mass and radius of C4780 B together with other VLMS with derived masses and radii, the parameters of which are given in Table 5, together with a few available VLMS models. The figure suggests that C4780 B might be the smallest main-sequence star detected so far1. Its radius is consistent and might even be below the radius predicted by theoretical models for an M-star with such mass, metallicity, and age.
The models presented in Fig. 10 display a theoretical spread, probably caused mainly by differences in age and metallicity. Several additional parameters, not plotted in Fig. 10, can have more of an impact on the mass-radius relation. In particular, fast rotation, magnetic activity, strong irradiation, and clouds have been considered in the literature (e.g., López-Morales 2007; Chabrier et al. 2007; Morales et al. 2010; Bouchy et al. 2011; Burrows et al. 2011; Knigge et al. 2011). Those effects can enlarge the theoretical spread of the models even further. Given this relatively wide range of theoretical stellar radii, no apparent inconsistency between the observed systems plotted in Fig. 10 and the available theory can be deduced at this point.
6. Conclusions
C4780 B is a transiting very-low-mass M-dwarf, whose radius is consistent and might even be smaller than the predictions of theoretical models. Its discovery adds an important piece to the puzzle that any modern stellar-evolution theory of VLMS, both in binaries and as single stars, would have to account for. Further investigation of the blending fraction (L3), for instance with a multicolor high-precision photometric observations, might reduce the uncertainties on its radius, thereby placing even stronger constraints. Since M-stars represent an overwhelming fraction of the galactic stellar population (e.g., Chabrier 2003; Kroupa et al. 2011), understanding their properties is important not only for advancing stellar astrophysics but also for other fields of science, like terrestrial exoplanet searches (Scalo et al. 2007).
The size of VLMS is comparable to that of giant planets, making such objects in binary systems one of the main false-alarm sources in any transiting-planet survey (e.g., Pont et al. 2006; Santerne et al. 2012). As a result, many such systems were considered as good transiting-planet candidates and were followed-up spectroscopically to determine their nature. Complete and homogeneous analysis of the systems that were detected by CoRoT and Kepler, similar to what Triaud et al. (2013) are aiming at using the WASP data, might considerably enhance our understanding of the astrophysics close to the low end of the main sequence.
Berger et al. (2009) reports a radius measurements of the primary in the L-dwarf binary 2MASS 0746+20 using radio emission. They derived 0.078 ± 0.010 R⊙ for this 0.085 ± 0.010 M⊙ L-dwarf. However, since this result is still under debate (e.g., Konopacky et al. 2012), we decided not to include 2MASS 0746+20 in the sample listed in Table 5.
Acknowledgments
We thank Gil Sokol for his help with the lightcurve analysis. We also thank the anonymous referee and the editor for their fruitful comments and suggestions. The CoRoT space mission, launched on 2006 December 27, was developed and is operated by the CNES, with participation of the Science Programs of ESA, ESA’s RSSD, Austria, Belgium, Brazil, Germany, and Spain. Some of the data presented were acquired with the IAC80 telescope operated at Teide Observatory on the island of Tenerife by the Instituto de Astrofísica de Canarias. The research leading to these results has received funding from the European Research Council under the EU’s Seventh Framework Program (FP7/(2007-2013)/ ERC Grant Agreement No. 291352). This research was also supported by the Israel Science Foundation (grant No. 1423/11). The IAC team acknowledges support by grant AYA2010-20982-C02-02 of the Spanish Ministerio de Economía y Competividad. We also acknowledge support from the French National Research Agency (ANR-08-JCJC-0102-01).
References
- Almenara, J. M., Deeg, H. J., Aigrain, S., et al. 2009, A&A, 506, 337 [NASA ADS] [CrossRef] [EDP Sciences] [Google Scholar]
- Auvergne, M., Bodin, P., Boisnard, L., et al. 2009, A&A, 506, 411 [NASA ADS] [CrossRef] [EDP Sciences] [Google Scholar]
- Baglin, A., Auvergne, M., Barge, P., et al. 2009, in IAU Symp., 253, 71 [Google Scholar]
- Bakos, G., Noyes, R. W., Kovács, G., et al. 2004, PASP, 116, 266 [NASA ADS] [CrossRef] [Google Scholar]
- Baraffe, I., Chabrier, G., Allard, F., & Hauschildt, P. H. 1998, A&A, 337, 403 [NASA ADS] [Google Scholar]
- Baranne, A., Queloz, D., Mayor, M., et al. 1996, A&AS, 119, 373 [NASA ADS] [CrossRef] [EDP Sciences] [Google Scholar]
- Basu, S., Verner, G. A., Chaplin, W. J., & Elsworth, Y. 2012, ApJ, 746, 76 [NASA ADS] [CrossRef] [Google Scholar]
- Beatty, T. G., Fernández, J. M., Latham, D. W., et al. 2007, ApJ, 663, 573 [NASA ADS] [CrossRef] [Google Scholar]
- Bentley, S. J., Smalley, B., Maxted, P. F. L., et al. 2009, A&A, 508, 391 [NASA ADS] [CrossRef] [EDP Sciences] [Google Scholar]
- Berger, E., Rutledge, R. E., Phan-Bao, N., et al. 2009, ApJ, 695, 310 [NASA ADS] [CrossRef] [Google Scholar]
- Borucki, W. J., Koch, D., Basri, G., et al. 2010, Science, 327, 977 [NASA ADS] [CrossRef] [PubMed] [Google Scholar]
- Bouchy, F., Moutou, C., Queloz, D., & the CoRoT Exoplanet Science Team 2009, in IAU Symp., 253, 129 [Google Scholar]
- Bouchy, F., Deleuil, M., Guillot, T., et al. 2011, A&A, 525, A68 [NASA ADS] [CrossRef] [EDP Sciences] [Google Scholar]
- Boyajian, T. S., von Braun, K., van Belle, G., et al. 2012, ApJ, 757, 112 [NASA ADS] [CrossRef] [Google Scholar]
- Brown, T. M. 2003, ApJ, 593, L125 [NASA ADS] [CrossRef] [Google Scholar]
- Bruntt, H., De Cat, P., & Aerts, C. 2008, A&A, 478, 487 [NASA ADS] [CrossRef] [EDP Sciences] [Google Scholar]
- Bruntt, H., Bedding, T. R., Quirion, P.-O., et al. 2010a, MNRAS, 405, 1907 [NASA ADS] [Google Scholar]
- Bruntt, H., Deleuil, M., Fridlund, M., et al. 2010b, A&A, 519, A51 [NASA ADS] [CrossRef] [EDP Sciences] [Google Scholar]
- Bruntt, H., Basu, S., Smalley, B., et al. 2012, MNRAS, 423, 122 [NASA ADS] [CrossRef] [Google Scholar]
- Burrows, A., Heng, K., & Nampaisarn, T. 2011, ApJ, 736, 47 [NASA ADS] [CrossRef] [Google Scholar]
- Cabrera, J., Fridlund, M., Ollivier, M., et al. 2009, A&A, 506, 501 [NASA ADS] [CrossRef] [EDP Sciences] [Google Scholar]
- Cardelli, J. A., Clayton, G. C., & Mathis, J. S. 1989, in Interstellar Dust, eds. L. J. Allamandola, & A. G. G. M. Tielens, IAU Symp., 135, 55 [Google Scholar]
- Carpano, S., Cabrera, J., Alonso, R., et al. 2009, A&A, 506, 491 [NASA ADS] [CrossRef] [EDP Sciences] [Google Scholar]
- Carpenter, J. M. 2001, AJ, 121, 2851 [NASA ADS] [CrossRef] [Google Scholar]
- Chabrier, G. 2003, PASP, 115, 763 [NASA ADS] [CrossRef] [Google Scholar]
- Chabrier, G., Gallardo, J., & Baraffe, I. 2007, A&A, 472, L17 [NASA ADS] [CrossRef] [EDP Sciences] [Google Scholar]
- Cutri, R. M., Skrutskie, M. F., van Dyk, S., et al. 2003, 2MASS All Sky Catalog of point sources [Google Scholar]
- Deeg, H. J., Gillon, M., Shporer, A., et al. 2009, A&A, 506, 343 [NASA ADS] [CrossRef] [EDP Sciences] [Google Scholar]
- Deleuil, M., Deeg, H. J., Alonso, R., et al. 2008, A&A, 491, 889 [NASA ADS] [CrossRef] [EDP Sciences] [Google Scholar]
- Deleuil, M., Meunier, J. C., Moutou, C., et al. 2009, AJ, 138, 649 [NASA ADS] [CrossRef] [Google Scholar]
- Deleuil, M., Moutou, C., & Bordé, P. 2011, Detection and Dynamics of Transiting Exoplanets, St. Michel l’Observatoire, France, eds. F. Bouchy, R. Díaz, & C. Moutou, EPJ Web Conf., 11, 1001 [Google Scholar]
- Demarque, P., Woo, J., Kim, Y., & Yi, S. K. 2004, ApJS, 155, 667 [NASA ADS] [CrossRef] [Google Scholar]
- Demory, B.-O., Ségransan, D., Forveille, T., et al. 2009, A&A, 505, 205 [NASA ADS] [CrossRef] [EDP Sciences] [Google Scholar]
- Dotter, A., Chaboyer, B., Jevremović, D., et al. 2008, ApJS, 178, 89 [NASA ADS] [CrossRef] [Google Scholar]
- Edvardsson, B., Andersen, J., Gustafsson, B., et al. 1993, A&A, 275, 101 [NASA ADS] [Google Scholar]
- Ford, E. B. 2005, AJ, 129, 1706 [Google Scholar]
- Fridlund, M., Hébrard, G., Alonso, R., et al. 2010, A&A, 512, A14 [NASA ADS] [CrossRef] [EDP Sciences] [Google Scholar]
- Grziwa, S., Pätzold, M., & Carone, L. 2012, MNRAS, 420, 1045 [NASA ADS] [CrossRef] [Google Scholar]
- Hebb, L., Wyse, R. F. G., Gilmore, G., & Holtzman, J. 2006, AJ, 131, 555 [NASA ADS] [CrossRef] [Google Scholar]
- Jones, H. R. A., Butler, R. P., Tinney, C. G., et al. 2003, MNRAS, 341, 948 [NASA ADS] [CrossRef] [Google Scholar]
- Knigge, C., Baraffe, I., & Patterson, J. 2011, ApJS, 194, 28 [NASA ADS] [CrossRef] [Google Scholar]
- Konopacky, Q. M., Ghez, A. M., Fabrycky, D. C., et al. 2012, ApJ, 750, 79 [NASA ADS] [CrossRef] [Google Scholar]
- Kraus, A. L., Tucker, R. A., Thompson, M. I., Craine, E. R., & Hillenbrand, L. A. 2011, ApJ, 728, 48 [NASA ADS] [CrossRef] [Google Scholar]
- Kroupa, P., Weidner, C., Pflamm-Altenburg, J., et al. 2011 [arXiv:1112.3340] [Google Scholar]
- Lacy, C. H. 1977, ApJ, 218, 444 [Google Scholar]
- Lane, B. F., Boden, A. F., & Kulkarni, S. R. 2001, ApJ, 551, L81 [Google Scholar]
- López-Morales, M. 2007, ApJ, 660, 732 [NASA ADS] [CrossRef] [Google Scholar]
- López-Morales, M., & Ribas, I. 2005, ApJ, 631, 1120 [NASA ADS] [CrossRef] [Google Scholar]
- Maxted, P. F. L., O’Donoghue, D., Morales-Rueda, L., Napiwotzki, R., & Smalley, B. 2007, MNRAS, 376, 919 [NASA ADS] [CrossRef] [Google Scholar]
- Mayor, M., Pepe, F., Queloz, D., et al. 2003, The Messenger, 114, 20 [NASA ADS] [Google Scholar]
- Mazeh, T., Tamuz, O., & North, P. 2006, MNRAS, 367, 1531 [NASA ADS] [CrossRef] [Google Scholar]
- Morales, J. C., Gallardo, J., Ribas, I., et al. 2010, ApJ, 718, 502 [NASA ADS] [CrossRef] [Google Scholar]
- Ofir, A., Gandolfi, D., Buchhave, L., et al. 2012, MNRAS, 423, L1 [NASA ADS] [CrossRef] [Google Scholar]
- Parsons, S. G., Marsh, T. R., Copperwheat, C. M., et al. 2010, MNRAS, 402, 2591 [NASA ADS] [CrossRef] [Google Scholar]
- Parsons, S. G., Gänsicke, B. T., Marsh, T. R., et al. 2012a, MNRAS, 426, 1950 [NASA ADS] [CrossRef] [Google Scholar]
- Parsons, S. G., Marsh, T. R., Gänsicke, B. T., et al. 2012b, MNRAS, 419, 304 [NASA ADS] [CrossRef] [Google Scholar]
- Parsons, S. G., Marsh, T. R., Gänsicke, B. T., et al. 2012c, MNRAS, 420, 3281 [NASA ADS] [Google Scholar]
- Pätzold, M., Endl, M., Csizmadia, S., et al. 2012, A&A, 545, A6 [NASA ADS] [CrossRef] [EDP Sciences] [Google Scholar]
- Pepe, F., Mayor, M., Galland, F., et al. 2002, A&A, 388, 632 [NASA ADS] [CrossRef] [EDP Sciences] [Google Scholar]
- Pollacco, D. L., Skillen, I., Collier Cameron, A., et al. 2006, PASP, 118, 1407 [NASA ADS] [CrossRef] [Google Scholar]
- Pont, F., Bouchy, F., Melo, C., et al. 2005a, A&A, 438, 1123 [NASA ADS] [CrossRef] [EDP Sciences] [Google Scholar]
- Pont, F., Melo, C. H. F., Bouchy, F., et al. 2005b, A&A, 433, L21 [NASA ADS] [CrossRef] [EDP Sciences] [Google Scholar]
- Pont, F., Moutou, C., Bouchy, F., et al. 2006, A&A, 447, 1035 [NASA ADS] [CrossRef] [EDP Sciences] [Google Scholar]
- Popper, D. M., & Etzel, P. B. 1981, AJ, 86, 102 [NASA ADS] [CrossRef] [Google Scholar]
- Pyrzas, S., Gänsicke, B. T., Marsh, T. R., et al. 2009, MNRAS, 394, 978 [NASA ADS] [CrossRef] [Google Scholar]
- Pyrzas, S., Gänsicke, B. T., Brady, S., et al. 2012, MNRAS, 419, 817 [NASA ADS] [CrossRef] [Google Scholar]
- Rojas-Ayala, B., Covey, K. R., Muirhead, P. S., & Lloyd, J. P. 2012, ApJ, 748, 93 [NASA ADS] [CrossRef] [Google Scholar]
- Santerne, A., Endl, M., Hatzes, A., et al. 2011, Detection and Dynamics of Transiting Exoplanets, St. Michel l’Observatoire, France, eds. F. Bouchy, R. Díaz, & C. Moutou, EPJ Web Conf., 11, 2001 [Google Scholar]
- Santerne, A., Díaz, R. F., Moutou, C., et al. 2012, A&A, 545, A76 [NASA ADS] [CrossRef] [EDP Sciences] [Google Scholar]
- Savage, B. D., & Mathis, J. S. 1979, ARA&A, 17, 73 [NASA ADS] [CrossRef] [Google Scholar]
- Scalo, J., Kaltenegger, L., Segura, A. G., et al. 2007, Astrobiology, 7, 85 [NASA ADS] [CrossRef] [PubMed] [Google Scholar]
- Sing, D. K. 2010, A&A, 510, A21 [Google Scholar]
- Tal-Or, L., Santerne, A., Mazeh, T., et al. 2011, A&A, 534, A67 [NASA ADS] [CrossRef] [EDP Sciences] [Google Scholar]
- Tamuz, O., Mazeh, T., & North, P. 2006, MNRAS, 367, 1521 [NASA ADS] [CrossRef] [Google Scholar]
- Tegmark, M., Strauss, M. A., Blanton, M. R., et al. 2004, Phys. Rev. D, 69, 103501 [CrossRef] [Google Scholar]
- Torres, G., Andersen, J., & Giménez, A. 2010, A&ARv, 18, 67 [Google Scholar]
- Torres, G., Fischer, D. A., Sozzetti, A., et al. 2012, ApJ, 757, 161 [NASA ADS] [CrossRef] [Google Scholar]
- Triaud, A. H. M. J., Hebb, L., Anderson, D. R., et al. 2013, A&A, 549, A18 [NASA ADS] [CrossRef] [EDP Sciences] [Google Scholar]
- Udry, S., Mayor, M., & Santos, N. C. 2003, A&A, 407, 369 [NASA ADS] [CrossRef] [EDP Sciences] [Google Scholar]
- Valenti, J. A., & Fischer, D. A. 2005, ApJS, 159, 141 [NASA ADS] [CrossRef] [MathSciNet] [Google Scholar]
- Valenti, J. A., & Piskunov, N. 1996, A&AS, 118, 595 [NASA ADS] [CrossRef] [EDP Sciences] [Google Scholar]
- Yi, S., Demarque, P., Kim, Y.-C., et al. 2001, ApJS, 136, 417 [NASA ADS] [CrossRef] [Google Scholar]
- Zucker, S., & Mazeh, T. 1994, ApJ, 420, 806 [NASA ADS] [CrossRef] [EDP Sciences] [MathSciNet] [Google Scholar]
- Zucker, S., Mazeh, T., Santos, N. C., Udry, S., & Mayor, M. 2003, A&A, 404, 775 [NASA ADS] [CrossRef] [EDP Sciences] [Google Scholar]
- Zucker, S., Mazeh, T., Santos, N. C., Udry, S., & Mayor, M. 2004, A&A, 426, 695 [NASA ADS] [CrossRef] [EDP Sciences] [MathSciNet] [Google Scholar]
All Tables
Coordinates and magnitudes of C4780 and of the main contaminator in its CoRoT-photometric mask.
All Figures
|
Fig. 1 C4780 lightcurve normalized by its median flux value. Top: the original lightcurve. Bottom: the detrended lightcurve moved down by 0.05, for clarity. |
| In the text | |
|
Fig. 2 The 8 transit-like events detected by CoRoT in C4780, each moved to its own timeframe (i.e. (n·P + T0) days were subtracted from the time stamp of each point, where n is the transit number, T0 = 2 454 240.3147 BJD, and P = 20.6837). Subsequent events were moved down by 0.02 for clarity. |
| In the text | |
|
Fig. 3 Images of the sky around C4780 (the star is at the center). Right: R-filter image taken on August 9, 2010, by the 1-m Wise Observatory telescope, Israel. Left: image taken by CoRoT, at the same scale and orientation. The rectangular line at the center outlines the CoRoT-photometric mask. Positions of nearby stars are indicated by small crosses. |
| In the text | |
|
Fig. 4 Three parts of the co-added HARPS spectrum of C4780 (blue), together with the fitted model spectrum (black). Top, middle, and bottom panels show 32 Å long parts of the spectrum, focused on the H α, Mg I b, and H β lines, respectively. |
| In the text | |
|
Fig. 5 Two sets of Y2 stellar isochrones from Demarque et al. (2004), one for [Fe/H] = 0.05 (solid lines) and one for [Fe/H] = 0.39 (dashed lines). Both sets are for [α/Fe] = 0 and ages of 0.2, 0.4, 1, 2, 4, 8, and 10 Gyr (going from left to right along the log g = 4.3 line). The estimated Teff and log g of C4780 A are marked by a star and their uncertainties are marked by an ellipse. |
| In the text | |
|
Fig. 6 RVs of C4780 as measured by HARPS. The solid line is the Keplerian model produced from the orbital parameters of Table 4, and the dashed line is the center-of-mass velocity. The residuals are plotted in the lower panel. Note the different scale. |
| In the text | |
|
Fig. 7 The primary transit (left panel) and the part where the secondary eclipse should have occurred (right panel) in the phase-folded lightcurve of C4780. Our best model is overplotted with a solid red line. The residuals were moved up by 0.97 for clarity. |
| In the text | |
|
Fig. 8 Histograms of the 12 free parameters of the model from the final MCMC chain. |
| In the text | |
|
Fig. 9 Selected correlation plots of parameter pairs from the final MCMC chain. For clarity, only one of every 500 points of the chain was plotted. |
| In the text | |
|
Fig. 10 Mass-radius diagram of VLMS (M ≲ 0.2 M⊙). The symbols represent observed stars, while the lines correspond to theoretical mass-radius relations. Red rectangles are secondary stars of main-sequence EBs, green circles are secondary stars of white dwarf + M-dwarf EBs, and blue diamonds are single stars (all references are given in Table 5). The black triangle stands for C4780 B. Solid blue lines correspond to theoretical isochrones of solar metallicity and ages of 0.25,1, and 5 Gyr (going from top to bottom along the 0.08 M⊙ line) from Baraffe et al. (1998). To illustrate the effect of metallicity on size dashed-red lines show the Dartmouth isochrones (Dotter et al. 2008) of 1 Gyr for [Fe/H] = 0.2 (upper line) and [Fe/H] = −0.5 (lower line). |
| In the text | |
Current usage metrics show cumulative count of Article Views (full-text article views including HTML views, PDF and ePub downloads, according to the available data) and Abstracts Views on Vision4Press platform.
Data correspond to usage on the plateform after 2015. The current usage metrics is available 48-96 hours after online publication and is updated daily on week days.
Initial download of the metrics may take a while.