Fig. 9
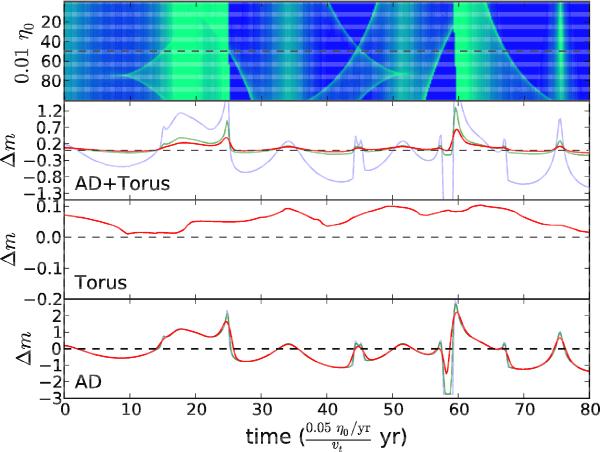
Example of microlensing light curve for a saddle-point image (with κ∗ = 0.07). The microlensing-induced flux variations (in mag) as a function of time are displayed for a source with Lbol = 1044.2 erg/s, and a compact torus model. The microlensing event duration scales with the inverse of the net transverse velocity vt expressed in Einstein radius/year. The upper panel shows a portion of the microlensing map from where the light curve is extracted. Blue (dark) region correspond to demagnification and green (light) region to magnification. The other panels show the light curve for the accretion disc (AD), for the torus, and for the composite source (AD+torus). The results are presented for three different wavelengths, 1 μm (light blue), 2.2 μm (light green), and 4.4 μm (red). Note that the torus model is the same for each wavelength.
Current usage metrics show cumulative count of Article Views (full-text article views including HTML views, PDF and ePub downloads, according to the available data) and Abstracts Views on Vision4Press platform.
Data correspond to usage on the plateform after 2015. The current usage metrics is available 48-96 hours after online publication and is updated daily on week days.
Initial download of the metrics may take a while.