Fig. 11
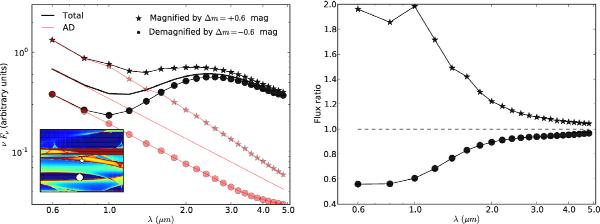
Left: example of modification of the SED due to microlensing. The reference SED of the accretion disc (red) and total SED (AD+torus; thick black) are shown with solid lines. The inset panel shows the source in two different regions of the microlensing map. The star shows the case of a micro-magnification of the AD by μ = 1.84 and the circle shows the case of a micro-demagnification of the AD by μ = 0.57 at 1.1 μm. The panel shows the corresponding SED of the accretion disc component (red) and of the total SED (black). Right: corresponding ratio between the microlensed and the unlensed (total) SED. The bump in the upper curve illustrates the non linear behaviour of microlensing produced by the complex caustic network.
Current usage metrics show cumulative count of Article Views (full-text article views including HTML views, PDF and ePub downloads, according to the available data) and Abstracts Views on Vision4Press platform.
Data correspond to usage on the plateform after 2015. The current usage metrics is available 48-96 hours after online publication and is updated daily on week days.
Initial download of the metrics may take a while.