Fig. 1
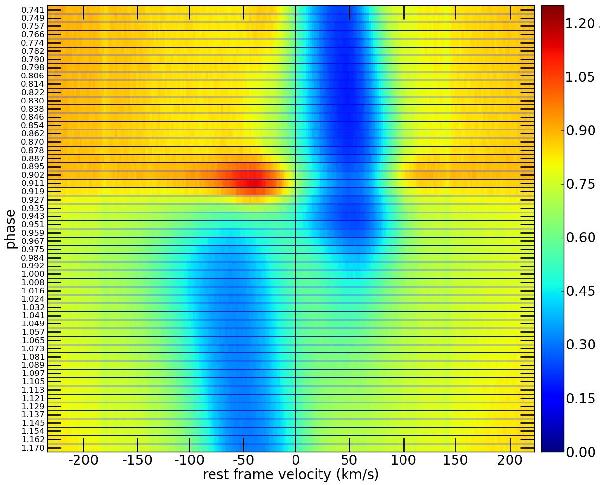
Time series of Hα lines of RR Lyr, ordered by increasing phase from top to bottom. Time series of ESPaDOnS spectra are interpolated to provide a 2-dimensional map of the Hα profile in the [− 200,200] km s-1 velocity range. Velocities are given in the stellar rest frame with positive velocities corresponding to inward motion (toward the photosphere). The spectrum pulsation phase is indicated on the left edge. On the right side, the color bar indicating the flux is from 0.0 to 1.2.
Current usage metrics show cumulative count of Article Views (full-text article views including HTML views, PDF and ePub downloads, according to the available data) and Abstracts Views on Vision4Press platform.
Data correspond to usage on the plateform after 2015. The current usage metrics is available 48-96 hours after online publication and is updated daily on week days.
Initial download of the metrics may take a while.