Fig. 6
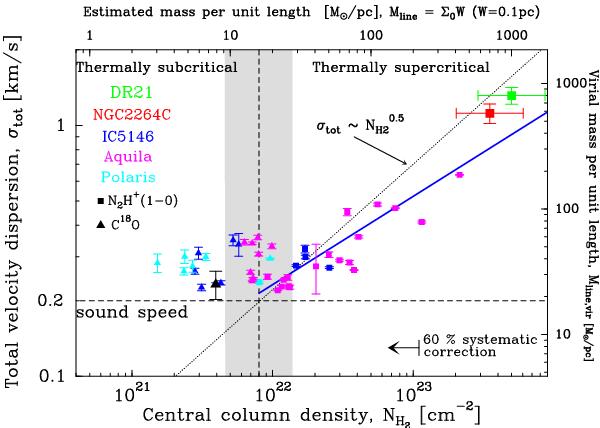
Total velocity dispersion versus observed central column density (uncorrected for inclination effects): blue for IC 5146, magenta for Aquila, cyan for Polaris, red for NGC 2264C, and green for DR21 filaments. The squares and triangles correspond to velocity dispersions measured from N2H + spectra and C18O spectra, respectively. See text for details on the error bars and for uncertainties in the column densities. The horizontal dashed line shows the value of the sound speed ~ 0.2 km s-1 for T = 10 K. The vertical dashed line marks the boundary between thermally subcritical and thermally supercritical filaments where the estimated mass per unit length Mline is approximately equal to the critical value Mline,crit ~ 16 M⊙/pc for T = 10 K, equivalent to a column density of 8 × 1021 cm-2. The grey band shows a dispersion of a factor of 3 around this nominal value. The dotted line running from the bottom left to the top right corresponds to σtot ∝ NH20.5 normalized to 0.2 km s-1 at the subcritical/supercritical boundary. The blue solid line shows the best power-law fit σtot ∝ NH20.35 ± 0.14 to the supercritical filaments.
Current usage metrics show cumulative count of Article Views (full-text article views including HTML views, PDF and ePub downloads, according to the available data) and Abstracts Views on Vision4Press platform.
Data correspond to usage on the plateform after 2015. The current usage metrics is available 48-96 hours after online publication and is updated daily on week days.
Initial download of the metrics may take a while.