Fig. 5
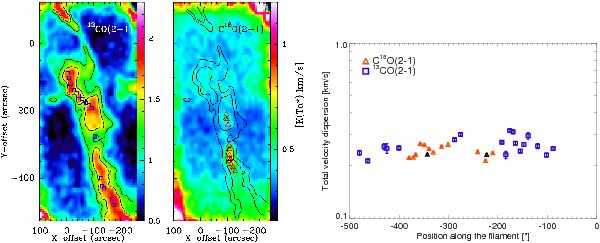
Left: integrated 13CO(2−1) and C18O(2−1) intensity maps of filament 14 in IC 5146 (cf. Fig. 3). Two 13CO(2−1) contours are overlaid: 1.2 and 1.5 K km s-1. The blue squares and red triangles correspond to the positions along the filament where the line-of-sight velocity dispersion has been measured from the 13CO(2−1) and C18O(2−1) maps respectively. The two black triangles on the C18O(2−1) map correspond to the positions of the central pixel of the array receiver of HERA observed in a single pointing. The labels indicate the offsets in arcsec relative to the center of the map at Ra(J2000) = 21:47:56 and Dec(J2000) = 48:08:55. The black triangle at position (−94″, −223″) is the point which represents filament 14 in the column density vs. velocity dispersion diagram (black triangle in Fig. 6). Right: total velocity dispersions, σtot (see Eq. (3)), measured along the same filament. The x-axis goes from the south to the north of the filament. The red triangle and blue squares correspond to measurements made on the C18O(2−1) and 13CO(2−1) maps, respectively. Individual spectra were constructed by spatially averaging the signal located within 10″ of the central position to increase the signal to noise ratio of the data. The linewidths of the 13CO(2−1) spectra were corrected for the broadening due to optical depth effects (see explanations in Sect. 4). The median value of σtot is 0.25 km s-1 with a narrow dispersion of 0.03 km s-1.
Current usage metrics show cumulative count of Article Views (full-text article views including HTML views, PDF and ePub downloads, according to the available data) and Abstracts Views on Vision4Press platform.
Data correspond to usage on the plateform after 2015. The current usage metrics is available 48-96 hours after online publication and is updated daily on week days.
Initial download of the metrics may take a while.