Fig. 4
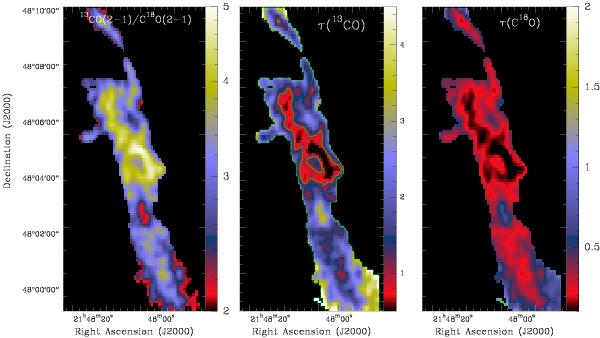
Left: integrated intensity ratio map  for filament 14 in IC 5146. Only those pixels where the column density derived from Herschel is higher than1021 H2 cm-2 have been considered (black contour in Fig. 3). Middle: map of the mean optical depth of the 13CO(2−1) transition. The contours in green correspond to a value of 1. Right: map of the mean optical depth of the C18O(2−1) transition. The mean optical depth of the C18O transition is τ(C18O) < 1 over the entire filament.
Current usage metrics show cumulative count of Article Views (full-text article views including HTML views, PDF and ePub downloads, according to the available data) and Abstracts Views on Vision4Press platform.
Data correspond to usage on the plateform after 2015. The current usage metrics is available 48-96 hours after online publication and is updated daily on week days.
Initial download of the metrics may take a while.