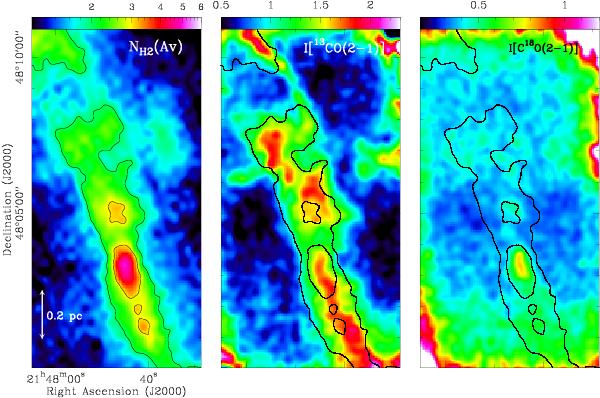
Fig. 3

Left: Herschel column density map of filament 14 in IC 5146 corresponding to the yellow rectangle in Fig. 1, in units of visual extinction (AV) where NH2 ~ AV × 1021 cm-2. The resolution of the map is 36.9″. The black contours correspond to column densities of 1 and 2 × 1021 cm-2. These contours are reproduced in the middle and right panels. Middle: 13CO(2−1) integrated intensity map (in units of K km s-1) over the LSR velocity range − 2.5 to 1 km s-1. The map has been smoothed to a resolution of 18.5″, which corresponds to half the resolution of the Herschel column density map. The 13CO(2−1) integrated emission of the filament is concentrated within the 1021 cm-2 column density contour, which traces the elongated structure of the filament. Right: same as the middle panel for the C18O(2−1) transition.
Current usage metrics show cumulative count of Article Views (full-text article views including HTML views, PDF and ePub downloads, according to the available data) and Abstracts Views on Vision4Press platform.
Data correspond to usage on the plateform after 2015. The current usage metrics is available 48-96 hours after online publication and is updated daily on week days.
Initial download of the metrics may take a while.


