Free Access
Fig. A.10
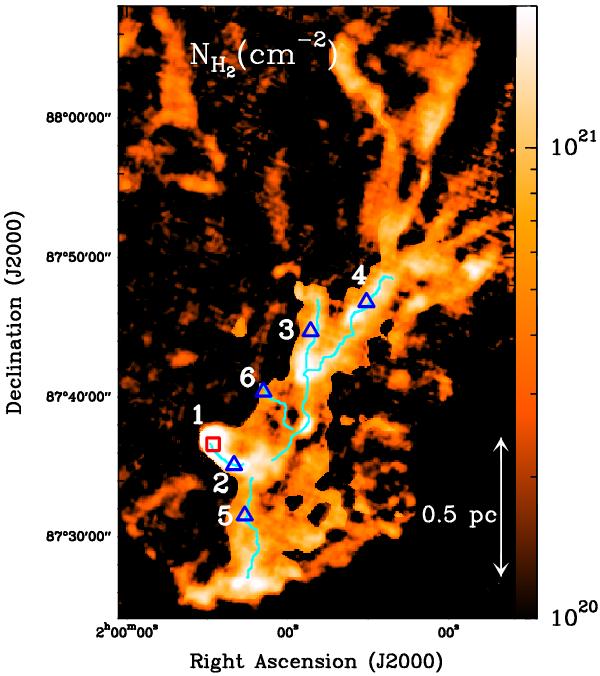
Curvelet component of the column density map of a subregion in the Polaris Cloud taken from André et al. (2010). The positions of the observed spectra are plotted in red squares and blue triangles for N2H+ and C18O, respectively. The numbers correspond to the filaments listed in Table 1.
Current usage metrics show cumulative count of Article Views (full-text article views including HTML views, PDF and ePub downloads, according to the available data) and Abstracts Views on Vision4Press platform.
Data correspond to usage on the plateform after 2015. The current usage metrics is available 48-96 hours after online publication and is updated daily on week days.
Initial download of the metrics may take a while.