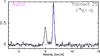
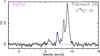
Fig. A.7
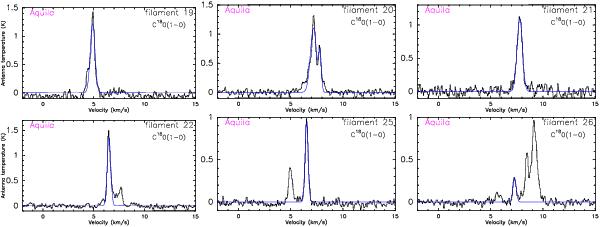
C18O(1−0) spectra observed toward 6 filaments in Aquila. The corresponding Gaussian fits are highlighted in blue. Note that the scale of the y-axis has been adjusted to match the peak temperature of each spectrum. Note 1: filament 20 shows two components separated by 0.63 km s-1. The component at VLSR = 7.17 km s-1 have been chosen to be tracing the filament, since this component has a velocity component which is closer to the average velocity ( km s-1) of the filaments in Aquila which show one velocity component. Note 2: the spectrum observed at the position of filament 22 shows two velocity components, one centered at 6.5 km s-1 and the other at 7.7 km s-1. The strongest component has been selected for similar reasons to that explained for filament 20. Note 3: the spectrum observed at the position of filament 25 has two velocity components (at 5.0 km s-1 and 6.52 km s-1, respectively). The strongest component has been selected for similar reasons to that explained for filament 20. Note 4: the spectrum observed at the position of filament 26 shows three velocity components centered at 7.28 km s-1, 8.45 km s-1 and 9.17 km s-1, respectively. The component centered at 7.28 km s-1 has been selected because it is the component with the closest VLSR value to the mean
  of neighboring filaments in Aquila.

Current usage metrics show cumulative count of Article Views (full-text article views including HTML views, PDF and ePub downloads, according to the available data) and Abstracts Views on Vision4Press platform.
Data correspond to usage on the plateform after 2015. The current usage metrics is available 48-96 hours after online publication and is updated daily on week days.
Initial download of the metrics may take a while.