Fig. A.5
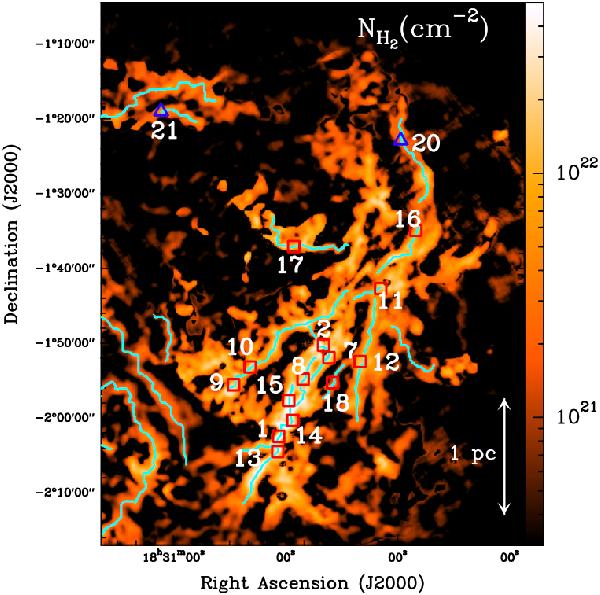
Curvelet component of the column density map of the Aquila field around the Serpens South filaments taken from André et al. (2010). The curvelet component is obtained using a morphological component analysis algorithm (MCA, from Starck et al. 2003) which enhances the contrast of the filamentary structure against the more diffuse background of the cloud. The positions of the observed spectra are plotted in red squares and blue triangles for N2H+ and C18O, respectively. The numbers correspond to the filaments listed in Table 1 and are given at the upper right of the spectra in Fig. A.4 and some of the spectra of Fig. A.7.
Current usage metrics show cumulative count of Article Views (full-text article views including HTML views, PDF and ePub downloads, according to the available data) and Abstracts Views on Vision4Press platform.
Data correspond to usage on the plateform after 2015. The current usage metrics is available 48-96 hours after online publication and is updated daily on week days.
Initial download of the metrics may take a while.