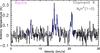
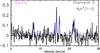
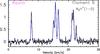
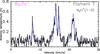
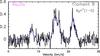
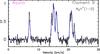
Fig. A.4
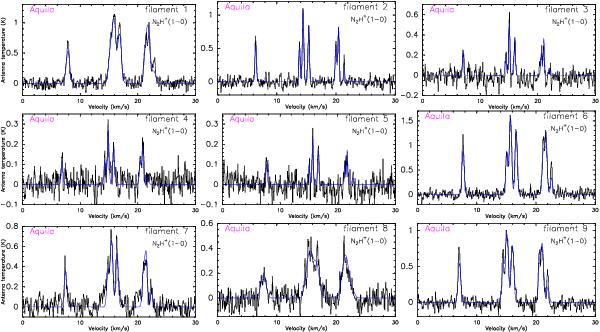
N2H+(1−0) spectra observed toward 9 filaments in Aquila. The numbers indicated on the upper right hand side of the plots, correspond to the filaments marked on the column density map of Fig. A.5 and listed in Table 1. The corresponding single-component hyperfine structure Gaussian fits are highlighted in blue. Note that the y-axis scale is not the same for all spectra, but has been adjusted to match the peak temperatures which vary between ~ 0.2 to > 3 K.
Current usage metrics show cumulative count of Article Views (full-text article views including HTML views, PDF and ePub downloads, according to the available data) and Abstracts Views on Vision4Press platform.
Data correspond to usage on the plateform after 2015. The current usage metrics is available 48-96 hours after online publication and is updated daily on week days.
Initial download of the metrics may take a while.