Fig. 1
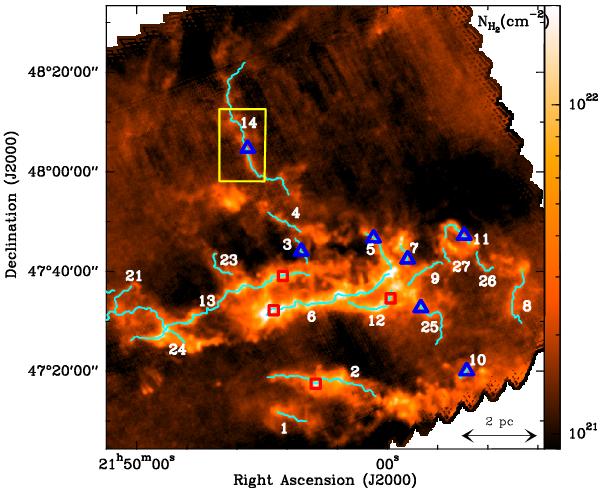
Herschel column density map of the northern and southern streamers of IC 5146 with the network of filaments highlighted in blue (adapted from Fig. 3b of Arzoumanian et al. 2011). The positions of the observed spectra are plotted as red squares and blue triangles for N2H+ and C18O, respectively (the corresponding spectra of the positions observed for filament 2 and filament 14 are shown in Fig. 2). The yellow rectangle shows the subcritical filament 14 which was mapped in C18O(2−1) and 13CO(2−1); cf. Fig. 3.
Current usage metrics show cumulative count of Article Views (full-text article views including HTML views, PDF and ePub downloads, according to the available data) and Abstracts Views on Vision4Press platform.
Data correspond to usage on the plateform after 2015. The current usage metrics is available 48-96 hours after online publication and is updated daily on week days.
Initial download of the metrics may take a while.