Fig. 9
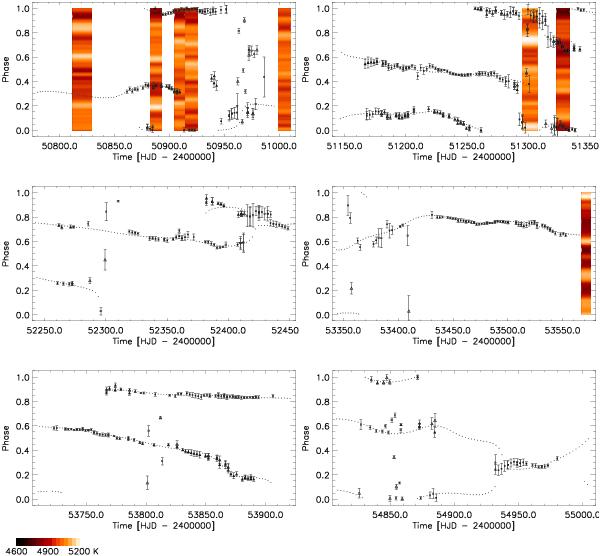
The photometric minima from the CF and CPS analysis of segments from left to right SEG4, SEG5, SEG8, SEG11, SEG12 and SEG15 plotted with longitudinal average slices of simultaneous Doppler images, when available. The dotted lines represent the primary and secondary minima from the CF analysis. The squares (primary) and triangles (secondary) show the CPS minima. The phases were calculated using the ephemeris HJDmin = 2 439 252.895 + 2.4002466E.
Current usage metrics show cumulative count of Article Views (full-text article views including HTML views, PDF and ePub downloads, according to the available data) and Abstracts Views on Vision4Press platform.
Data correspond to usage on the plateform after 2015. The current usage metrics is available 48-96 hours after online publication and is updated daily on week days.
Initial download of the metrics may take a while.