Fig. 9
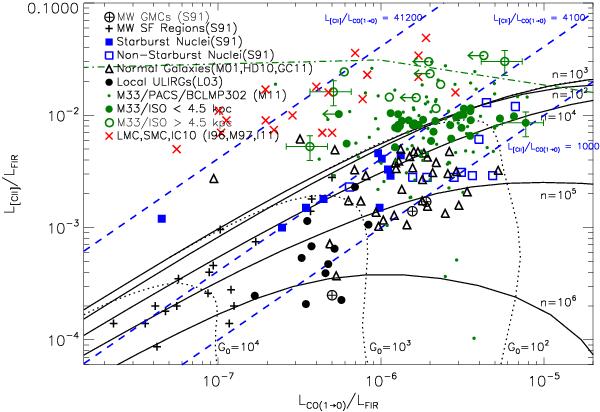
[C ii] versus CO, which are normalized with the FIR continuum. Big green filled circles show ISO/LWS data of the inner S1, N1 regions of M 33, while open circles show data of the outer S2, N2 regions. Small green circles show PACS observations of the BCLMP 302 H ii region in M 33 (M11). In addition we show data from Milky Way GMCs, from star-forming regions, and from other galaxies, which are compiled from Stacey et al. (1991, S91), Hailey-Dunsheath et al. (2010, HD10), Graciá-Carpio et al. (2011, GC11), Israel et al. (1996, I96), Israel & Maloney (2011, I11), Madden et al. (1997, M97), Malhotra et al. (2001, M01), and Luhman et al. (2003, L03). The lowest [C ii]/CO ratio observed with ISO/LWS in M 33 is 1000 (lower blue dashed line), while the highest ratio is 41 200 (upper blue dashed line). Black solid and dotted lines indicate lines of constant density n and FUV field G0, respectively, from the standard K99 PDR model with AV = 10 mag and solar metallicity Z = 1. The dashed-dotted green line shows a K99 PDR model result for AV = 1 mag, Z = 1, and n = 103 cm-3. The knee of this curve is for G0 = 100.5 (cf. Fig. 18 in K99).
Current usage metrics show cumulative count of Article Views (full-text article views including HTML views, PDF and ePub downloads, according to the available data) and Abstracts Views on Vision4Press platform.
Data correspond to usage on the plateform after 2015. The current usage metrics is available 48-96 hours after online publication and is updated daily on week days.
Initial download of the metrics may take a while.