Fig. 8
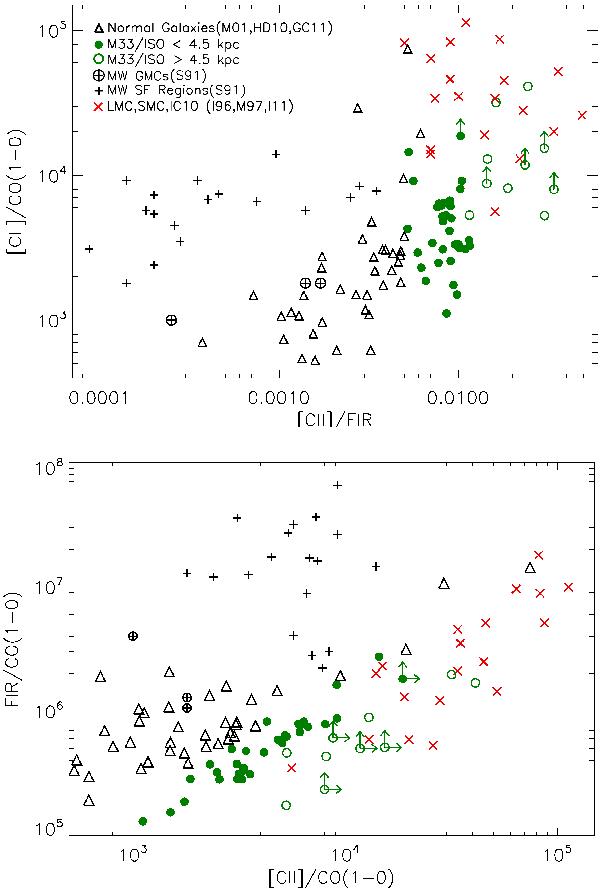
Diagnostic plots of the ratios of [C ii], CO and the FIR continuum for M 33 and for four other types of objects, low-metallicity systems, normal galaxies, Milky Way star-forming regions, and GMCs. Upper panel: [C ii]/CO 1−0 vs. [C ii]/FIR. Bottom panel: FIR/CO 1−0 vs. [C ii]/CO 1−0. All panels are shown on a logarithmic scale. Symbols used have the same meaning than those used in Fig. 7.
Current usage metrics show cumulative count of Article Views (full-text article views including HTML views, PDF and ePub downloads, according to the available data) and Abstracts Views on Vision4Press platform.
Data correspond to usage on the plateform after 2015. The current usage metrics is available 48-96 hours after online publication and is updated daily on week days.
Initial download of the metrics may take a while.