Fig. 7
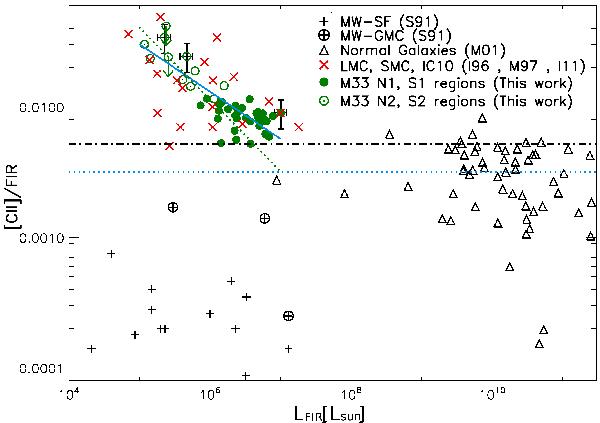
[C ii]/FIR ratio as function of LFIR. The blue solid line shows a linear fit to the whole data set of M 33 while the green dotted line shows a linear fit to N2 and S2 points of the outer galaxy only. The black dashed-dotted horizontal line shows the lower [C ii]/FIR value found in our data set of M 33. The blue dotted horizontal line shows the average [C ii]/FIR value in normal galaxies (Malhotra et al. 2001, M01). We also show data of Milky Way regions (Stacey et al. 1991, S91) and the low-metallicity objects LMC, SMC, IC 10 (Israel et al. 1996, I96), (Israel & Maloney 2011, I11), (Madden et al. 1997, M97).
Current usage metrics show cumulative count of Article Views (full-text article views including HTML views, PDF and ePub downloads, according to the available data) and Abstracts Views on Vision4Press platform.
Data correspond to usage on the plateform after 2015. The current usage metrics is available 48-96 hours after online publication and is updated daily on week days.
Initial download of the metrics may take a while.