Fig. 12
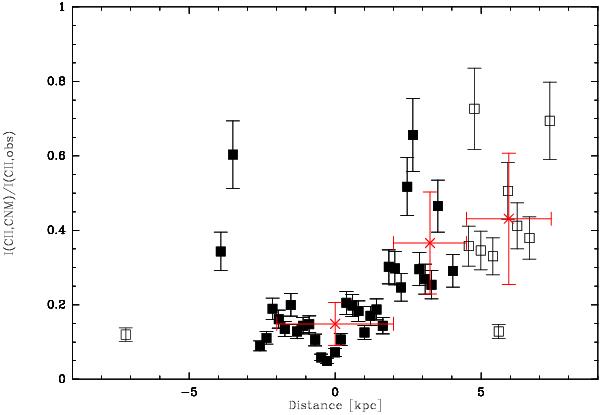
Fraction of the observed [C ii] emission stemming from the cold neutral medium for T = 80 K and n = 100 cm-3, after correction of the observed H i for the contribution from PDRs. Squares mark the individual data along the major axis. Their errorbars only include the 15% observational error of the H i intensities. Crosses in red mark the fractions averaged over the inner 2 kpc, the northern 2 to 4.5 kpc, and the outer, northern disk between 4.5 and 7.4 kpc. Corresponding errorbars show the standard deviation of the individual data and the radius interval over which the values were binned.
Current usage metrics show cumulative count of Article Views (full-text article views including HTML views, PDF and ePub downloads, according to the available data) and Abstracts Views on Vision4Press platform.
Data correspond to usage on the plateform after 2015. The current usage metrics is available 48-96 hours after online publication and is updated daily on week days.
Initial download of the metrics may take a while.