Fig. 10
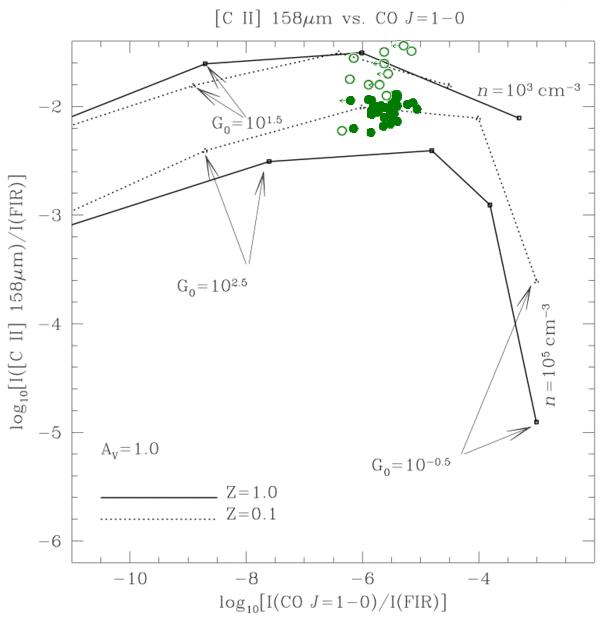
[C ii] versus CO, which are normalized with the FIR continuum (Fig. 18 of K99). Black solid and dotted lines indicate lines of constant density for metallicities of Z = 1.0 and Z = 0.1, respectivey, from the K99 PDR model using AV = 1 mag. Big green filled circles show ISO/LWS data of the inner S1, N1 regions of M 33, while open circles show data of the outer S2, N2 regions.
Current usage metrics show cumulative count of Article Views (full-text article views including HTML views, PDF and ePub downloads, according to the available data) and Abstracts Views on Vision4Press platform.
Data correspond to usage on the plateform after 2015. The current usage metrics is available 48-96 hours after online publication and is updated daily on week days.
Initial download of the metrics may take a while.