Fig. 9
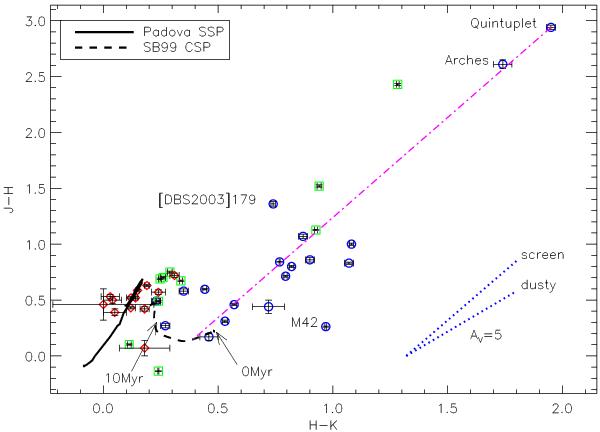
Sample observed colour–colour diagram with different symbols indicating age ranges: t(Myr) < 7 (blue circle), 7 < t(Myr) < 20 (green square), 20 < t(Myr) < 100 (red diamond). The three young clusters near the Galactic centre and M 42 are labelled. Continuous and dashed lines represent the colours of the Padova SSPs and the SB99 CSP, respectively. Model ages range from very early phases to 100 Myr, indicated for the CSP models. The magenta dot-dashed line connects the observed and the intrinsic colours of Quintuplet. Blue dotted lines show the extinction yielded by AV = 5 for both a standard screen reddening vector and a dusty cluster medium.
Current usage metrics show cumulative count of Article Views (full-text article views including HTML views, PDF and ePub downloads, according to the available data) and Abstracts Views on Vision4Press platform.
Data correspond to usage on the plateform after 2015. The current usage metrics is available 48-96 hours after online publication and is updated daily on week days.
Initial download of the metrics may take a while.